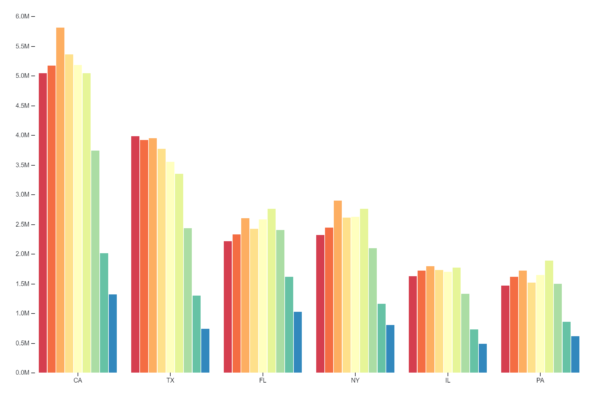
A grouped bar chart is a graphical representation that displays multiple bars grouped together in clusters, with each cluster representing a distinct category or subcategory. This type of chart is commonly used to compare the values of different subgroups within each category, allowing for quick visual comparison and analysis of data across multiple variables.
Purposes :
Certainly! Here are some purposes of using a grouped bar chart:
Comparison: Grouped bar charts are utilized to compare the values of different categories across multiple subgroups or variables. This comparison helps in identifying trends, differences, or similarities within and across categories.
Segmentation: They allow for the segmentation of data into distinct groups or categories, making it easier to analyze and understand the composition of each category in relation to its subgroups.
Highlighting Patterns: Grouped bar charts facilitate the visualization of patterns or relationships between various subgroups within each category, aiding in the interpretation of complex data sets.
Identifying Variances: By displaying data in separate groups of bars, grouped bar charts help in identifying variances or disparities between different subgroups or categories, enabling users to pinpoint areas of interest or concern.
Data Exploration: They support data exploration by providing a structured representation of data, allowing users to delve into different aspects of the data and uncover insights through visual examination.
Effective Communication: Grouped bar charts serve as effective communication tools for presenting data-driven insights to stakeholders or audiences in a clear, concise, and visually appealing manner.
Facilitating Decision-Making: By presenting data in a comparative format, grouped bar charts assist in decision-making processes by providing decision-makers with valuable insights into the performance or characteristics of various subgroups or categories.
Temporal Analysis: When used in conjunction with a time-based dataset, grouped bar charts can aid in temporal analysis by visualizing changes or trends in data over time within different categories.
Comparative Performance Analysis: They are often employed in business and finance for comparative performance analysis of different products, services, departments, or regions, allowing for informed decision-making and strategic planning.
Evaluation of Experiments: In scientific research or experimentation, grouped bar charts help evaluate the impact of different variables or treatments on a dependent variable across multiple conditions or groups.
Uses :
Comparative Analysis: Grouped bar charts are widely used to compare the values of multiple categories across different subgroups or variables. For example, comparing sales figures of various products across different regions.
Segmentation: They help in segmenting data into distinct groups or categories, allowing for a clear understanding of how each category is composed in terms of its subgroups. This is useful for demographic analysis, market segmentation, etc.
Trend Analysis: Grouped bar charts are effective in visualizing trends over time or across different scenarios. For instance, tracking monthly revenue for different product categories over several years.
Performance Evaluation: They are utilized for evaluating the performance of different entities, such as departments, teams, or individuals, across various metrics or KPIs (Key Performance Indicators).
Survey Results: Grouped bar charts are commonly employed to display survey responses across different categories or demographic groups. This helps in understanding how opinions or preferences vary among different segments of the population.
Experimental Data Analysis: In scientific research or experimentation, grouped bar charts are used to analyze and compare the results of experiments across different conditions, treatments, or experimental groups.
Financial Analysis: Grouped bar charts assist in financial analysis by comparing the financial performance of companies, investment portfolios, or financial instruments across different time periods or market conditions.
Product Comparison: They are valuable for comparing the attributes or features of different products or services across various categories, aiding consumers in making informed purchasing decisions.
Performance Benchmarking: Grouped bar charts help in benchmarking the performance of an entity against its competitors or industry standards across different parameters.
Resource Allocation: Organizations use grouped bar charts to analyze resource allocation across different departments, projects, or initiatives, ensuring optimal utilization of resources based on performance metrics.
Reviews
There are no reviews yet.
Only logged in customers who have purchased this product may leave a review.

Reviews
There are no reviews yet.