Sale!

Marimekko chart

Original price was: $ 15.Current price is: $ 10.

Description

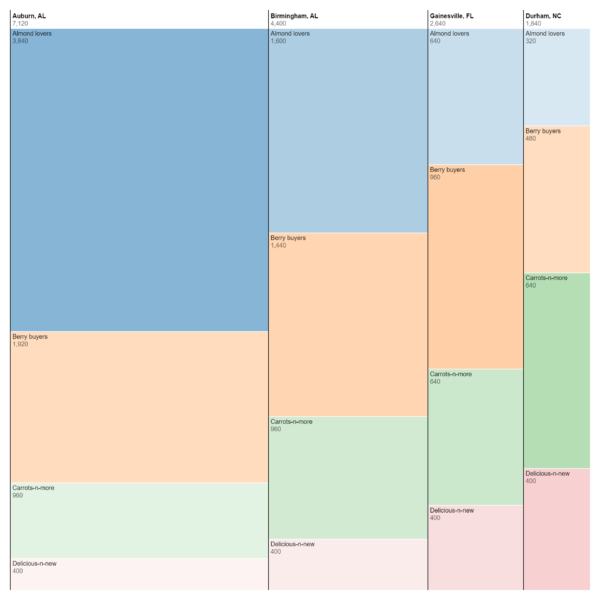
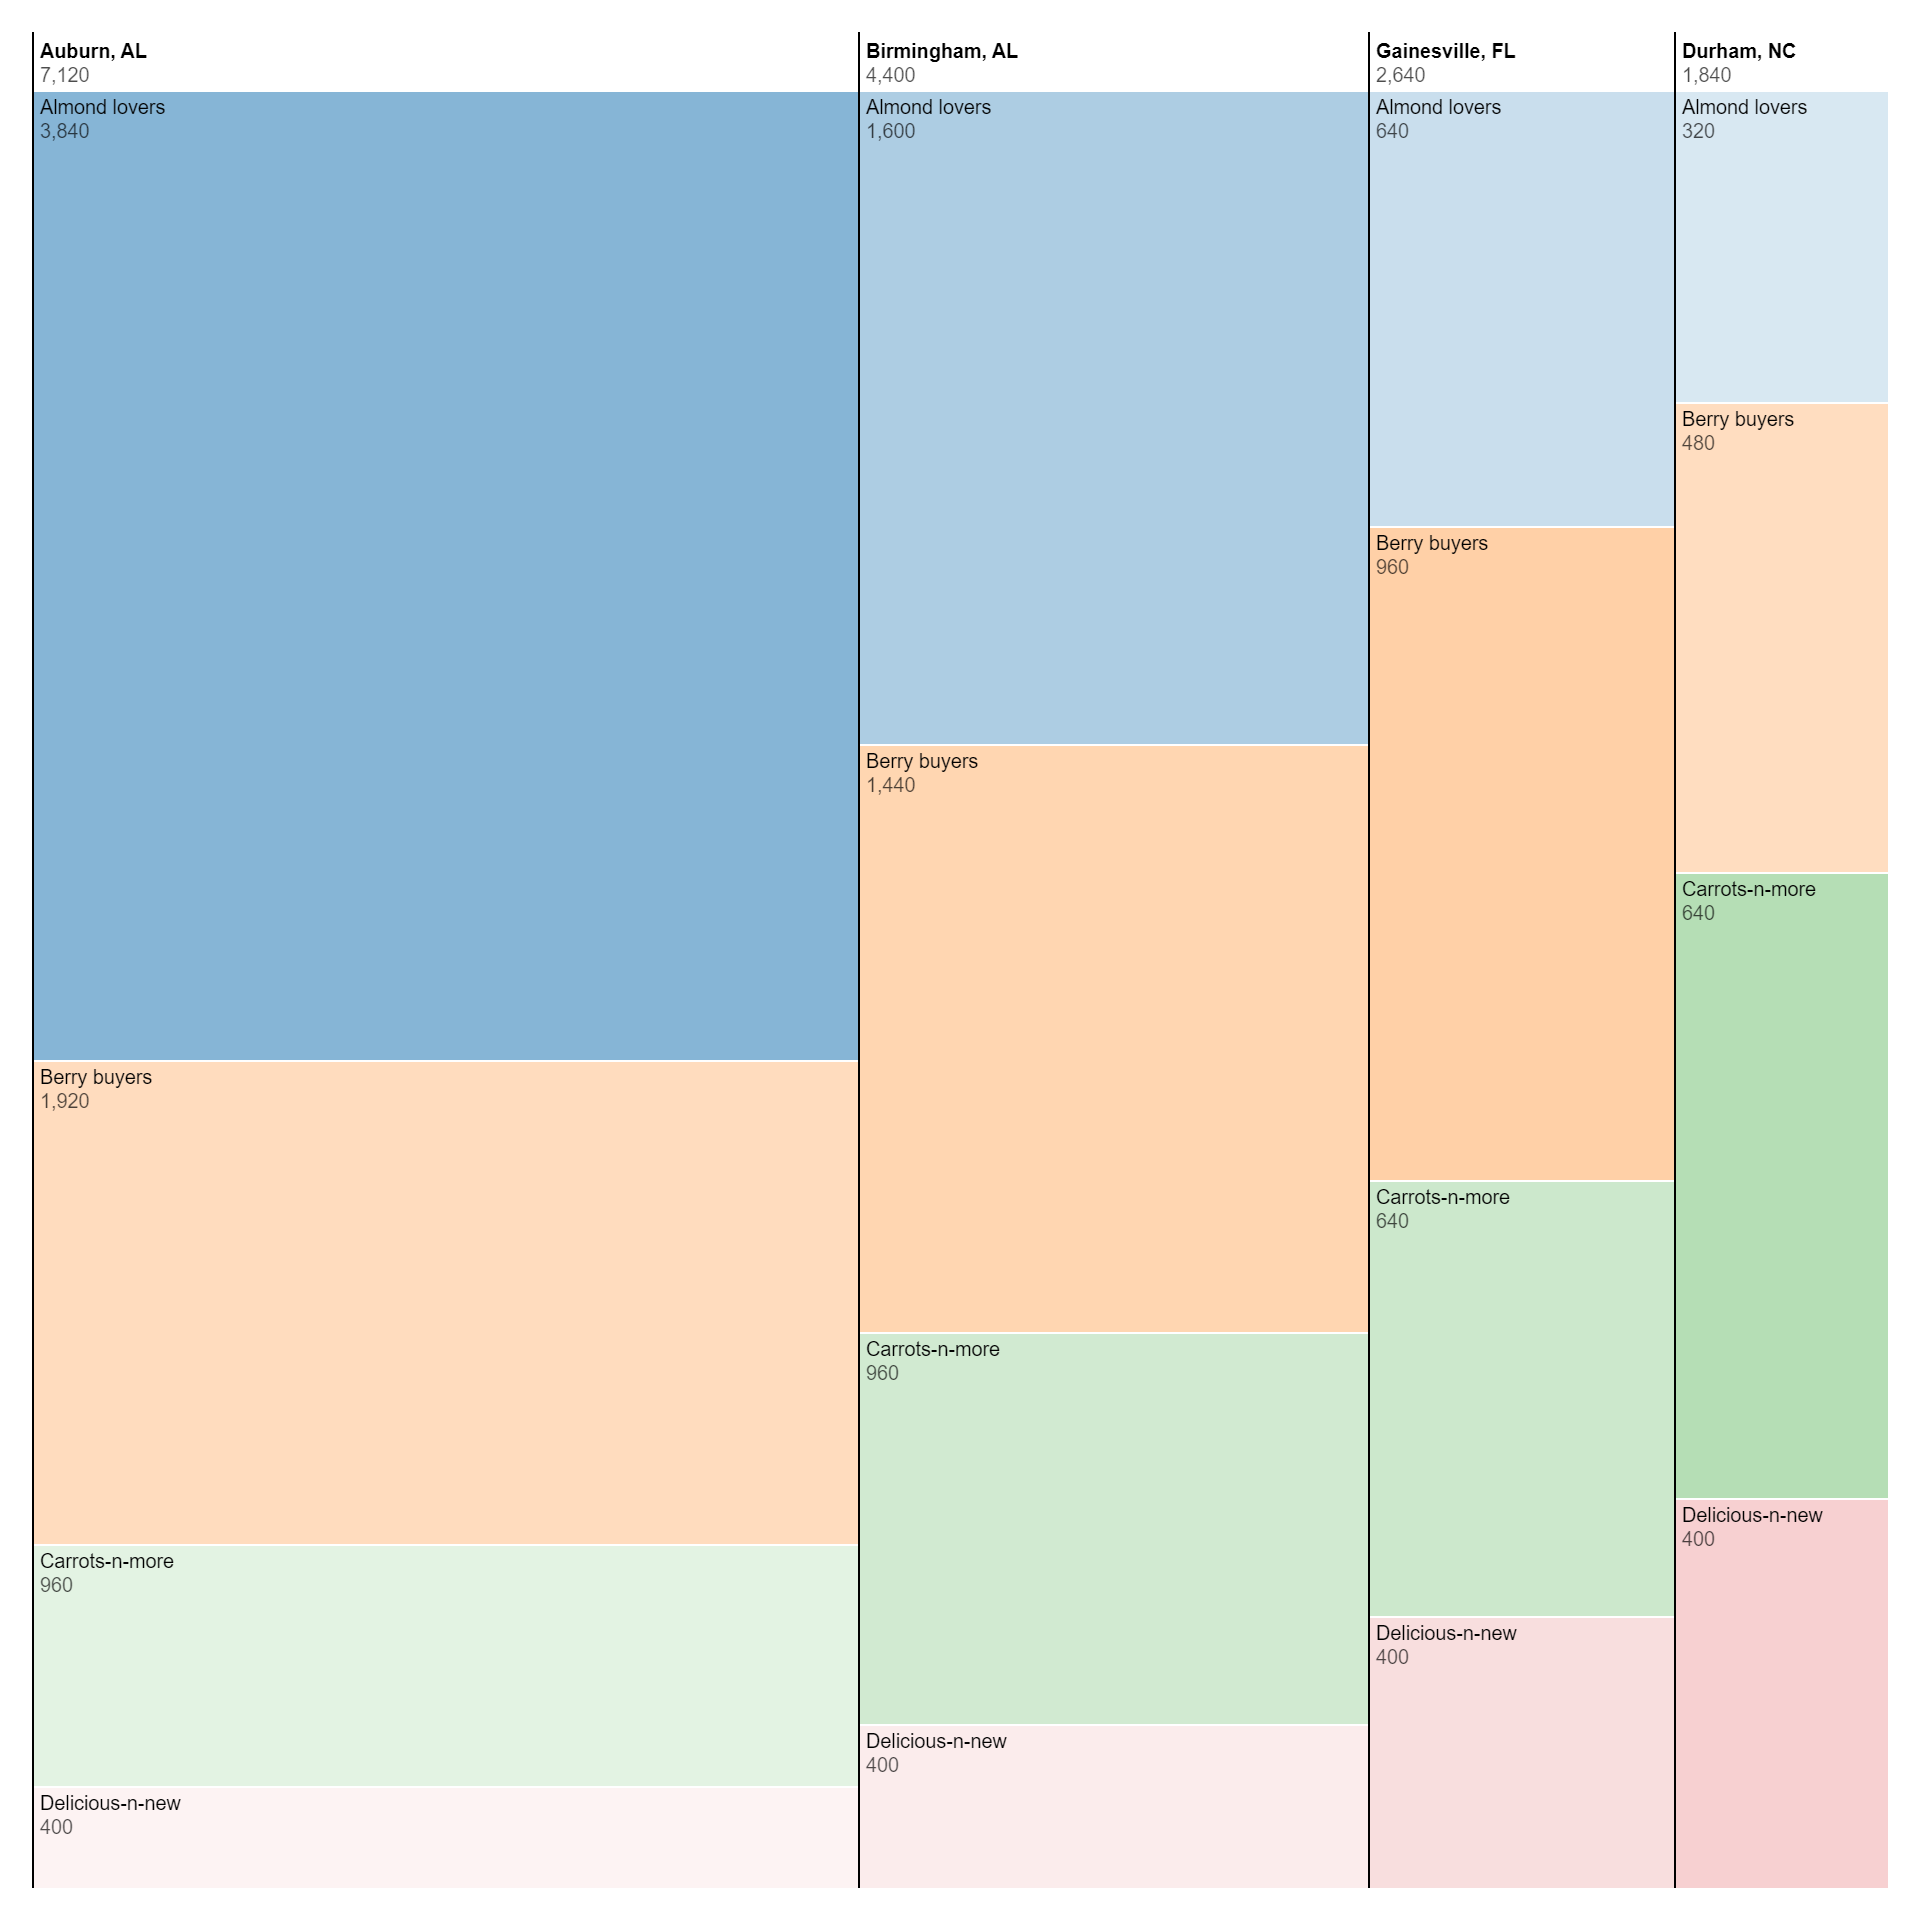
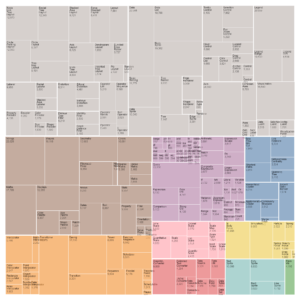
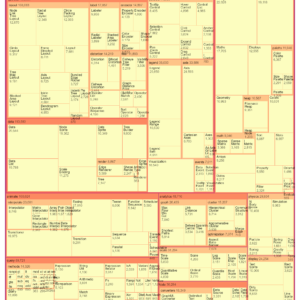
A Marimekko chart, also known as a mosaic plot or a mekko chart, is a graphical representation that combines both bar and stacked bar charts to display categorical data in two dimensions. It represents the relationship between two categorical variables by using the width of the bars to represent one variable and the height to represent the other. This chart type is particularly useful for visualizing the distribution of data across multiple categories and subcategories, allowing for easy comparison and analysis of proportions within each category.

Purposes :

The purposes of using a Marimekko chart include:

  1. Visualizing Categorical Data: Marimekko charts are effective for visualizing categorical data, providing a clear representation of the distribution of variables across different categories and subcategories.
  2. Comparing Proportions: They allow for easy comparison of proportions within each category, as the width of the bars represents one variable and the height represents another, making it simple to see relative sizes and proportions.
  3. Identifying Trends: Marimekko charts help in identifying trends or patterns within the data by visualizing how the proportions of variables change across categories or subcategories.
  4. Analyzing Market Segmentation: They are commonly used in market research and marketing to analyze market segmentation, showing how different customer segments are distributed across various product categories or geographic regions.
  5. Product Portfolio Analysis: Marimekko charts assist in analyzing product portfolios by visualizing the distribution of products across different market segments or product categories, helping businesses identify opportunities for growth or diversification.
  6. Resource Allocation: They aid in resource allocation by visualizing how resources are distributed across different departments, projects, or initiatives, enabling organizations to allocate resources effectively based on priorities and needs.
  7. Sales Performance Analysis: Marimekko charts help analyze sales performance by visualizing the distribution of sales across different product categories, regions, or customer segments, providing insights into areas of strength and areas for improvement.
  8. Budget Analysis: They assist in budget analysis by visualizing how budget allocations are distributed across different expense categories or departments, helping organizations track spending and identify areas for cost optimization.
  9. Supply Chain Analysis: Marimekko charts are used in supply chain management to visualize the distribution of products or materials across different stages of the supply chain, aiding in inventory management and logistics planning.
  10. Project Management: They are useful in project management for visualizing the distribution of tasks or resources across different project phases or team members, facilitating project planning and monitoring progress.

Uses :

Certainly! Here are several common uses of Marimekko charts:

  1. Market Segmentation: Marimekko charts are used to analyze market segmentation by visualizing how different customer segments are distributed across various product categories or geographic regions.
  2. Product Portfolio Analysis: They assist in analyzing product portfolios by visualizing the distribution of products across different market segments or product categories, helping businesses identify opportunities for growth or diversification.
  3. Resource Allocation: Marimekko charts aid in resource allocation by visualizing how resources are distributed across different departments, projects, or initiatives, enabling organizations to allocate resources effectively based on priorities and needs.
  4. Sales Performance Analysis: They help analyze sales performance by visualizing the distribution of sales across different product categories, regions, or customer segments, providing insights into areas of strength and areas for improvement.
  5. Budget Analysis: Marimekko charts assist in budget analysis by visualizing how budget allocations are distributed across different expense categories or departments, helping organizations track spending and identify areas for cost optimization.
  6. Supply Chain Analysis: They are used in supply chain management to visualize the distribution of products or materials across different stages of the supply chain, aiding in inventory management and logistics planning.
  7. Project Management: Marimekko charts are useful in project management for visualizing the distribution of tasks or resources across different project phases or team members, facilitating project planning and monitoring progress.
  8. Market Share Analysis: They assist in analyzing market share by visualizing the distribution of market share among competitors within an industry or market segment.
  9. Customer Segmentation: Marimekko charts help analyze customer segmentation by visualizing how different customer groups are distributed across various product categories or service offerings.
  10. Process Analysis: They are used to analyze processes by visualizing the distribution of resources, time, or activities across different stages or components of the process, helping identify bottlenecks or areas for improvement.

Reviews

There are no reviews yet.

Only logged in customers who have purchased this product may leave a review.