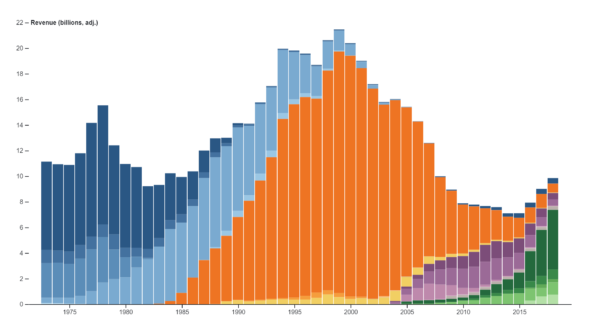
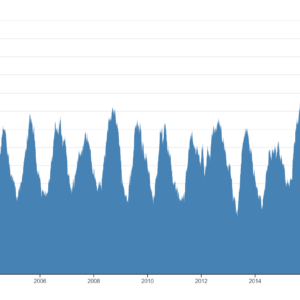
The “Revenue by Music Format 1973-2018 Chart” provides a concise visual representation of the revenue generated by various music formats from 1973 to 2018. This dynamic chart utilizes interactive features to present data on the revenue trends of formats such as vinyl, cassette tapes, CDs, digital downloads, and streaming services over the specified time period. The chart allows viewers to explore how the music industry’s revenue has evolved with technological advancements and changes in consumer preferences throughout the years.
The purposes of a “Revenue by Music Format 1973-2018 Chart” include:
Visualizing Revenue Trends: The chart allows users to visualize the revenue trends of different music formats over a span of several decades, providing insights into the evolution of the music industry.
Comparing Revenue Streams: Users can compare the revenue generated by various music formats, such as vinyl, cassette tapes, CDs, digital downloads, and streaming services, to understand their relative importance and contribution to the overall music market.
Analyzing Market Shifts: By observing changes in revenue patterns over time, users can analyze market shifts and identify trends in consumer preferences, technological advancements, and industry dynamics.
Identifying Growth Opportunities: The chart helps stakeholders identify growth opportunities within the music industry by highlighting emerging formats or markets that have experienced significant revenue growth during the specified time period.
Informing Business Decisions: Music industry professionals, including artists, record labels, and streaming platforms, can use the chart to inform strategic business decisions related to product development, marketing strategies, and revenue optimization.
Understanding Technological Changes: The chart illustrates the impact of technological changes on the music industry, such as the transition from physical formats like vinyl and CDs to digital downloads and streaming services.
Historical Perspective: Users gain a historical perspective on the music industry’s revenue trends, allowing for a deeper understanding of past events, regulatory changes, and economic factors that have influenced revenue generation.
Forecasting Future Trends: By analyzing historical revenue data, users can make informed predictions and forecasts about future trends in the music industry, helping businesses and policymakers anticipate market developments and plan accordingly.
Educational Tool: The chart serves as an educational tool for students, researchers, and enthusiasts interested in the music industry, providing a visual representation of revenue trends and market dynamics.
Enhancing Stakeholder Communication: The chart facilitates communication and collaboration among stakeholders in the music industry by providing a clear and accessible visualization of revenue data that can be easily shared and interpreted.
Uses :
Here are some common uses of a revenue by music format chart spanning from 1973 to 2018:
Market Analysis: The chart allows analysts to assess the performance of different music formats over time, providing insights into market trends, consumer preferences, and revenue distribution among formats.
Business Strategy Development: Music industry stakeholders, including record labels, artists, and streaming platforms, can use the chart to develop strategic plans and investment strategies based on revenue trends and market dynamics.
Product Development: Companies involved in music production and distribution can use the chart to inform product development decisions, such as prioritizing certain formats or investing in new technologies based on revenue trends.
Marketing Planning: The chart helps marketers identify target audiences and develop marketing strategies tailored to specific music formats, considering factors such as consumer demographics and preferences.
Competitive Analysis: Music industry competitors can use the chart to benchmark their performance against industry averages and identify areas for improvement or opportunities for growth within specific music formats.
Financial Planning: Financial analysts and investors can use the chart to assess the financial performance of companies operating in the music industry, helping them make informed investment decisions.
Regulatory Compliance: Music industry regulators and policymakers can use the chart to monitor revenue distribution among different formats and assess the impact of regulatory changes on market dynamics and revenue trends.
Academic Research: Researchers and scholars studying the music industry can use the chart as a data source for academic research projects, analyzing revenue trends and market dynamics to contribute to the scholarly understanding of the industry.
Educational Purposes: Educators can use the chart as a teaching tool in music business courses or industry-related seminars, helping students understand revenue trends and market dynamics in the music industry.
Public Awareness: Media outlets and industry publications can use the chart to raise public awareness about the changing landscape of the music industry, highlighting trends and developments that may impact consumers and industry stakeholders.
Reviews
There are no reviews yet.
Only logged in customers who have purchased this product may leave a review.

Reviews
There are no reviews yet.