Sale!

Global tempreature trends

Original price was: $ 15.Current price is: $ 10.

Description

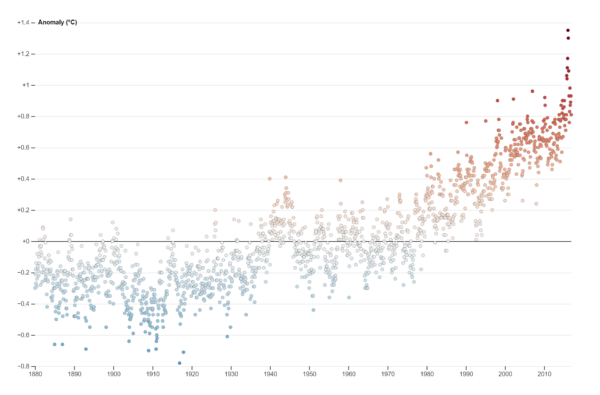
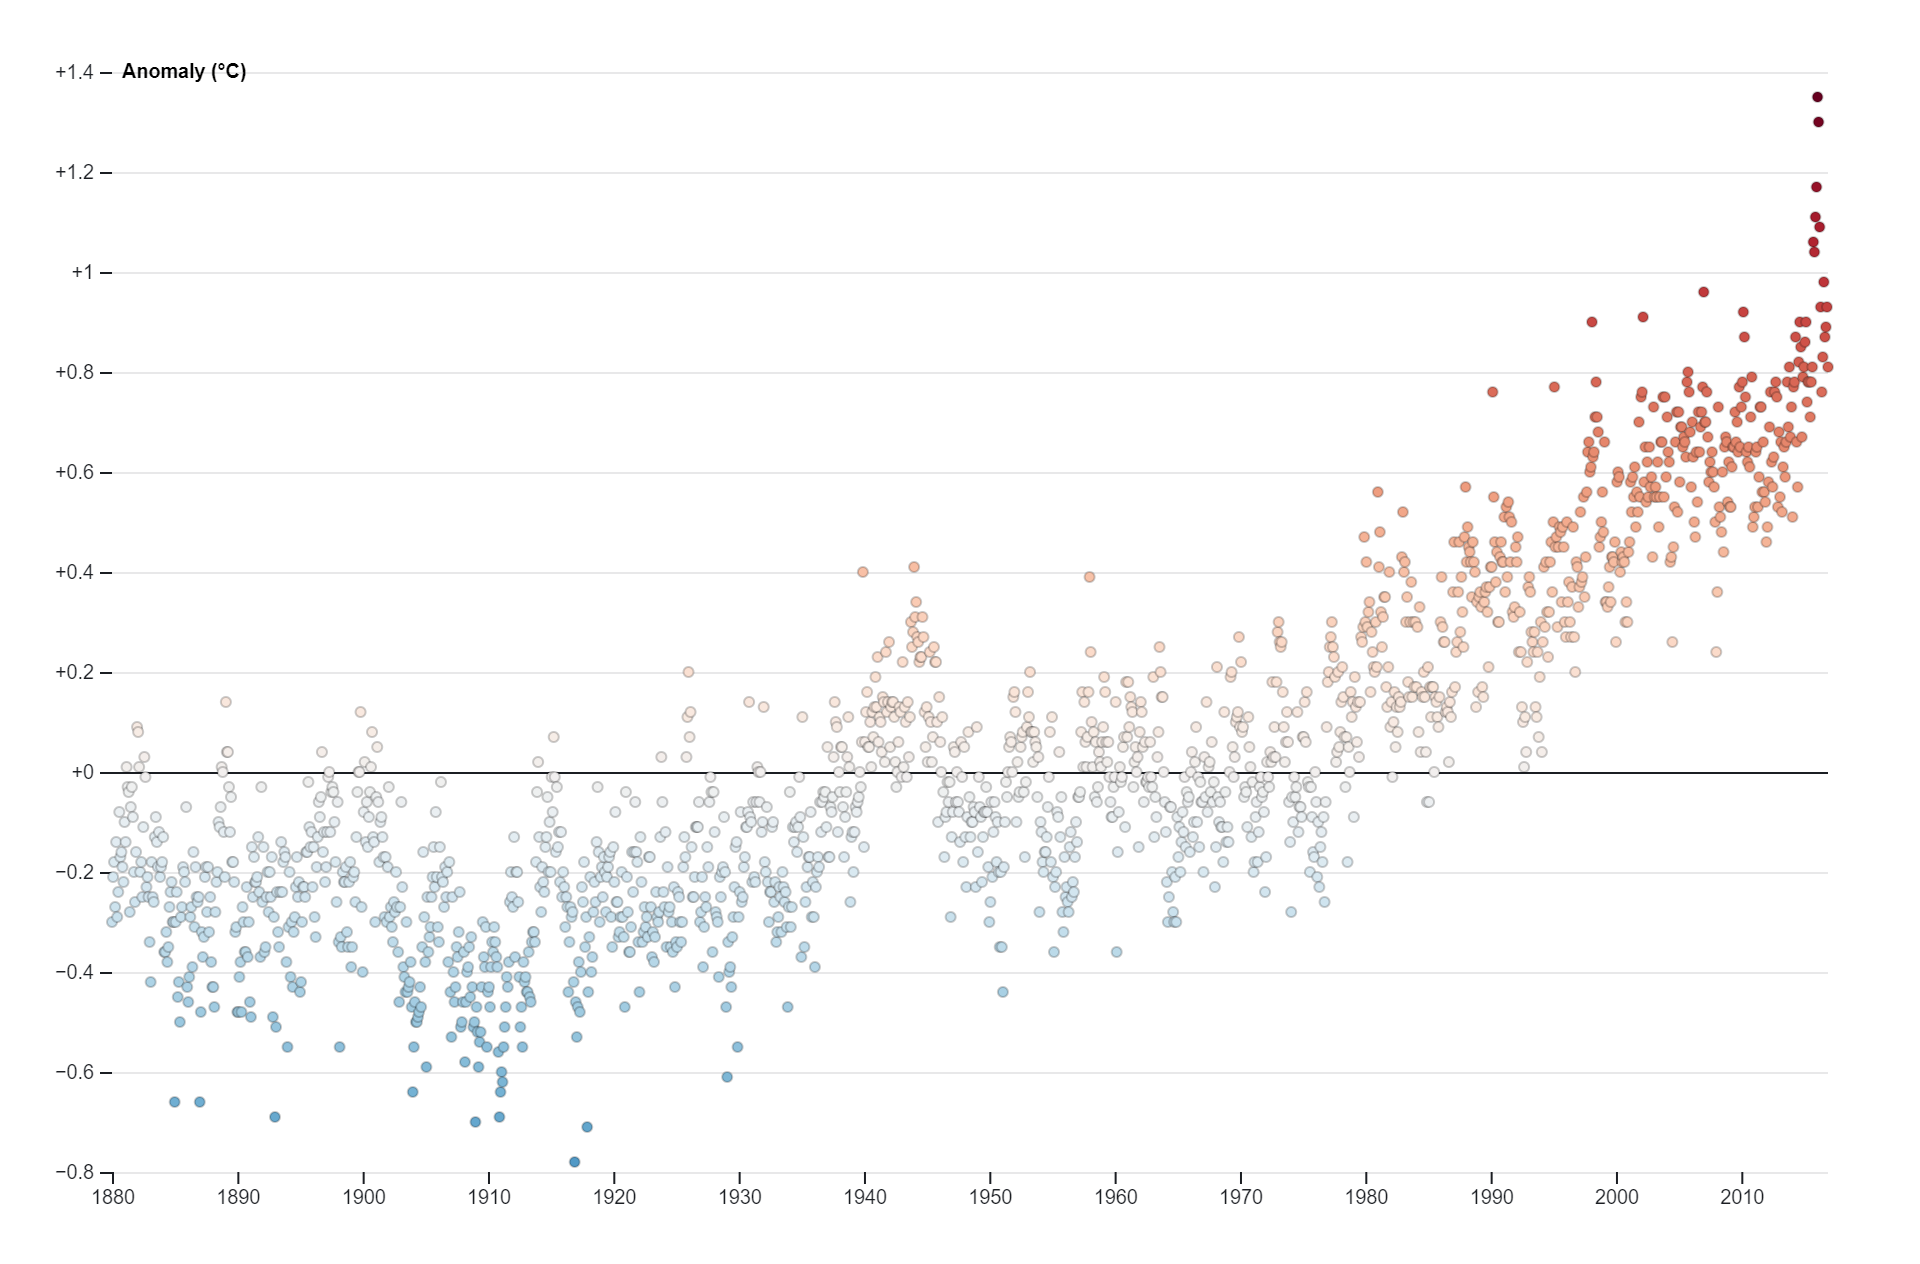
Global temperature trends refer to the overall changes in average temperatures across the Earth’s surface over an extended period, typically decades or centuries. These trends are analyzed using data collected from weather stations, satellites, and other sources, revealing patterns of warming or cooling over time. In recent decades, scientific evidence has shown a significant and consistent increase in global temperatures, primarily attributed to human activities such as greenhouse gas emissions. These trends are of critical importance for understanding climate change and its potential impacts on ecosystems, weather patterns, and human societies worldwide.

Purposes :

The purposes of global temperature trend  charts include:

  1. Visualizing Climate Change: Global temperature trend charts provide a visual representation of how average temperatures have changed over time, helping users understand the phenomenon of climate change and its impact on the planet.
  2. Identifying Long-term Trends: They facilitate the identification of long-term trends in global temperatures, allowing users to observe patterns of warming or cooling over decades or centuries.
  3. Highlighting Anomalies: Temperature trend charts can highlight anomalous periods of warming or cooling, such as particularly warm years or periods of abrupt temperature change, enabling users to understand the variability of climate over time.
  4. Supporting Scientific Research: These charts serve as valuable tools for scientific research, providing researchers with a visual means to analyze historical temperature data and investigate factors contributing to climate change.
  5. Informing Policy-Making: Global temperature trend charts help policymakers understand the urgency of addressing climate change and inform decision-making processes related to environmental policies, mitigation strategies, and adaptation measures.
  6. Educating the Public: They serve as educational resources for raising awareness about climate change among the general public, helping to convey the importance of mitigating greenhouse gas emissions and protecting the environment.
  7. Monitoring Environmental Health: Temperature trend charts support the monitoring of environmental health by providing a quantitative measure of changes in Earth’s climate system, including impacts on ecosystems, biodiversity, and natural resources.
  8. Predicting Future Climate Trends: By analyzing historical temperature data, these charts can inform projections and models used to predict future climate trends and scenarios, helping to anticipate potential impacts and plan for resilience measures.
  9. Comparing Regional Trends: Users can compare temperature trends across different regions of the globe, allowing for regional assessments of climate change impacts and adaptation strategies tailored to specific geographic areas.
  10. Tracking Policy Effectiveness: Temperature trend charts can be used to track the effectiveness of climate policies and initiatives aimed at reducing greenhouse gas emissions, mitigating climate change, and promoting sustainable development.

Uses :

Global temperature trends  charts serve various purposes and have several uses, including:

  1. Visualizing Climate Data: They are used to visually represent historical temperature data over time, providing a clear depiction of global temperature trends and variations.
  2. Analyzing Climate Change: Global temperature trend charts are essential for analyzing long-term climate change patterns, including temperature increases or decreases, fluctuations, and anomalies.
  3. Understanding Climate Dynamics: These charts help in understanding the complex dynamics of the Earth’s climate system by visualizing how global temperatures change over different time scales, from annual to decadal and beyond.
  4. Identifying Warming Trends: They are used to identify warming trends by visually highlighting periods of temperature increase over time, aiding in the assessment of the pace and magnitude of global warming.
  5. Assessing Climate Impacts: Global temperature trend charts assist in assessing the impacts of climate change on various ecosystems, habitats, and human societies by providing evidence of temperature shifts and their consequences.
  6. Supporting Climate Policy: These charts provide empirical evidence for policymakers and stakeholders to understand the urgency of addressing climate change and support the development of effective climate policies and mitigation strategies.
  7. Educational Purposes: They serve as educational tools for teaching about climate change, global warming, and related environmental concepts, allowing students and the general public to understand the significance and implications of temperature trends.
  8. Communicating Scientific Findings: Global temperature trend charts help scientists communicate their research findings and discoveries to broader audiences, including policymakers, media, and the public, fostering awareness and understanding of climate issues.
  9. Monitoring Climate Agreements: They are used to monitor progress towards international climate agreements, such as the Paris Agreement, by tracking global temperature trends and assessing whether temperature targets are being met.
  10. Informing Adaptation Strategies: These charts inform adaptation strategies by providing insights into how temperature trends may affect different regions and sectors, helping communities and organizations prepare for and respond to climate impacts.

Overall, global temperature trend D3 charts play a crucial role in climate science, policy-making, education, and public awareness efforts aimed at addressing the challenges of climate change.

Reviews

There are no reviews yet.

Only logged in customers who have purchased this product may leave a review.