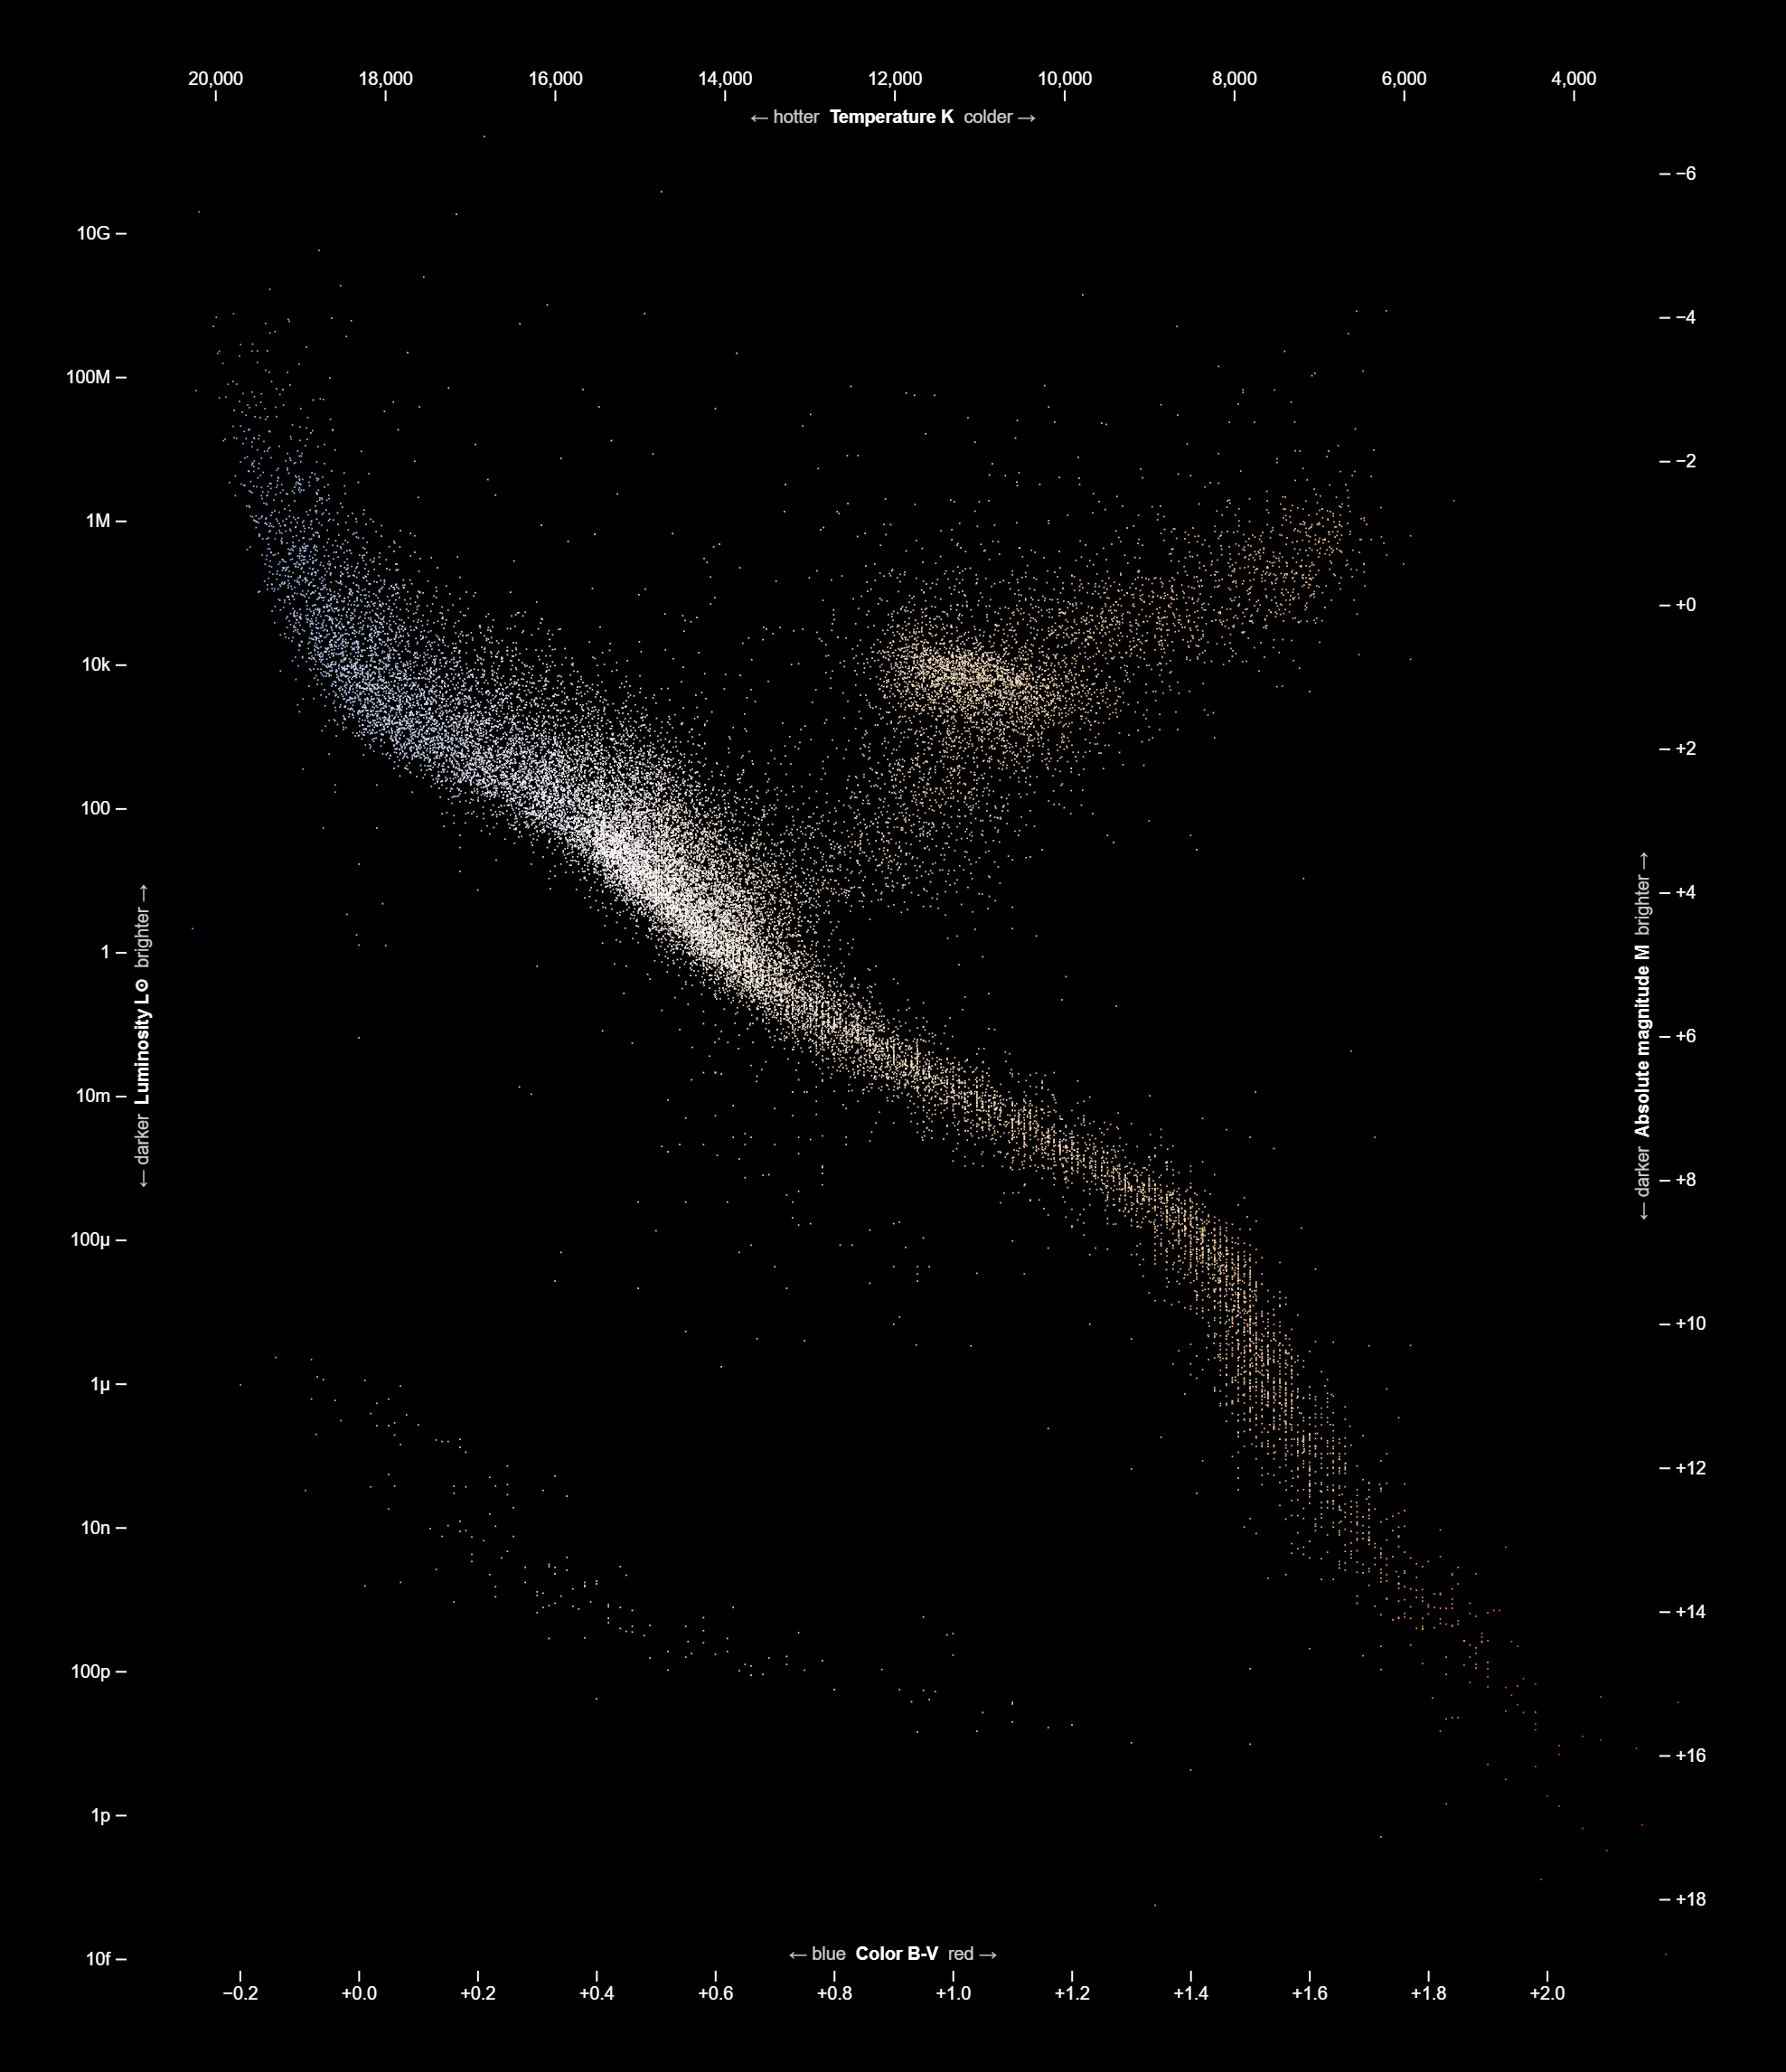
The Hertzsprung-Russell (HR) Diagram Chart is a graphical representation that plots stars’ luminosity (brightness) against their surface temperature (color). This dynamic chart helps astronomers visualize and classify stars based on their characteristics, revealing patterns such as the main sequence, giants, and supergiants. It serves as a valuable tool for studying stellar evolution and understanding the life cycles of stars.
Purposes :
The purposes of a Hertzsprung-Russell (HR) Diagram chart include:
Stellar Classification: The HR diagram allows astronomers to classify stars based on their luminosity and surface temperature, providing insights into their evolutionary stage, size, and composition.
Stellar Evolution: It helps astronomers study the life cycles of stars by visualizing their positions on the diagram and tracking changes in luminosity and temperature over time.
Identifying Stellar Populations: The HR diagram can reveal different populations of stars within a galaxy, such as main sequence stars, giants, and supergiants, aiding in understanding the structure and dynamics of stellar populations.
Determining Star Formation History: By analyzing the distribution of stars on the HR diagram, astronomers can infer the star formation history of a galaxy or stellar population, including the rate of star formation and the duration of different evolutionary stages.
Calibrating Stellar Models: The HR diagram helps calibrate theoretical models of stellar evolution by comparing predicted positions of stars on the diagram with observed data, improving our understanding of stellar physics and astrophysical processes.
Studying Binary Systems: Binary star systems can be identified and studied on the HR diagram, revealing information about the masses, orbits, and interactions between the stars in the system.
Determining Stellar Ages: By comparing a star’s position on the HR diagram with theoretical evolutionary tracks, astronomers can estimate the age of a star or stellar population, providing valuable information about the history and evolution of galaxies.
Investigating Stellar Variability: Variations in a star’s luminosity or temperature can be studied by observing changes in its position on the HR diagram over time, helping astronomers understand processes such as stellar pulsations, eruptions, and variability.
Exploring Exoplanetary Systems: The HR diagram can be used to study host stars of exoplanetary systems, providing insights into the properties and characteristics of exoplanets and their potential habitability.
Educational Tool: The HR diagram serves as an educational tool for students and enthusiasts interested in astronomy, providing a visual representation of stellar properties and evolution in a clear and accessible format.
Uses :
Here are some common uses of a Hertzsprung-Russell (HR) Diagram D3 chart:
Stellar Classification: Astronomers use HR diagrams to classify stars based on their luminosity and temperature, distinguishing between main sequence stars, giants, supergiants, white dwarfs, and other stellar types.
Stellar Evolution: HR diagrams help astronomers study the life cycles of stars by visualizing their positions on the diagram and tracking changes in luminosity and temperature over time. This aids in understanding how stars evolve from birth to death.
Determining Stellar Properties: By analyzing the position of stars on the HR diagram, astronomers can determine properties such as mass, radius, age, and chemical composition, providing valuable insights into the characteristics of stars.
Identifying Stellar Populations: HR diagrams reveal different populations of stars within galaxies, clusters, and other stellar systems. This helps astronomers understand the structure, dynamics, and history of these systems.
Studying Star Clusters: HR diagrams are used to study star clusters, where stars of similar age and composition are grouped together. By analyzing the distribution of stars on the diagram, astronomers can learn about the formation and evolution of star clusters.
Investigating Binary Systems: Binary star systems can be identified and studied on HR diagrams, providing information about the masses, orbits, and interactions between the stars in these systems.
Exploring Variable Stars: HR diagrams help astronomers study variable stars by observing changes in their positions on the diagram over time. This provides insights into processes such as pulsations, eruptions, and variability in stellar brightness and temperature.
Understanding Galactic Structure: By analyzing the distribution of stars on HR diagrams in different regions of a galaxy, astronomers can learn about the structure, dynamics, and formation history of the galaxy.
Calibrating Stellar Models: HR diagrams are used to calibrate theoretical models of stellar evolution by comparing predicted positions of stars on the diagram with observed data. This improves our understanding of stellar physics and astrophysical processes.
Educational Tool: HR diagrams serve as educational tools for students and enthusiasts interested in astronomy, providing a visual representation of stellar properties, evolution, and classification in a clear and accessible format.
Reviews
There are no reviews yet.
Only logged in customers who have purchased this product may leave a review.

Reviews
There are no reviews yet.