Description
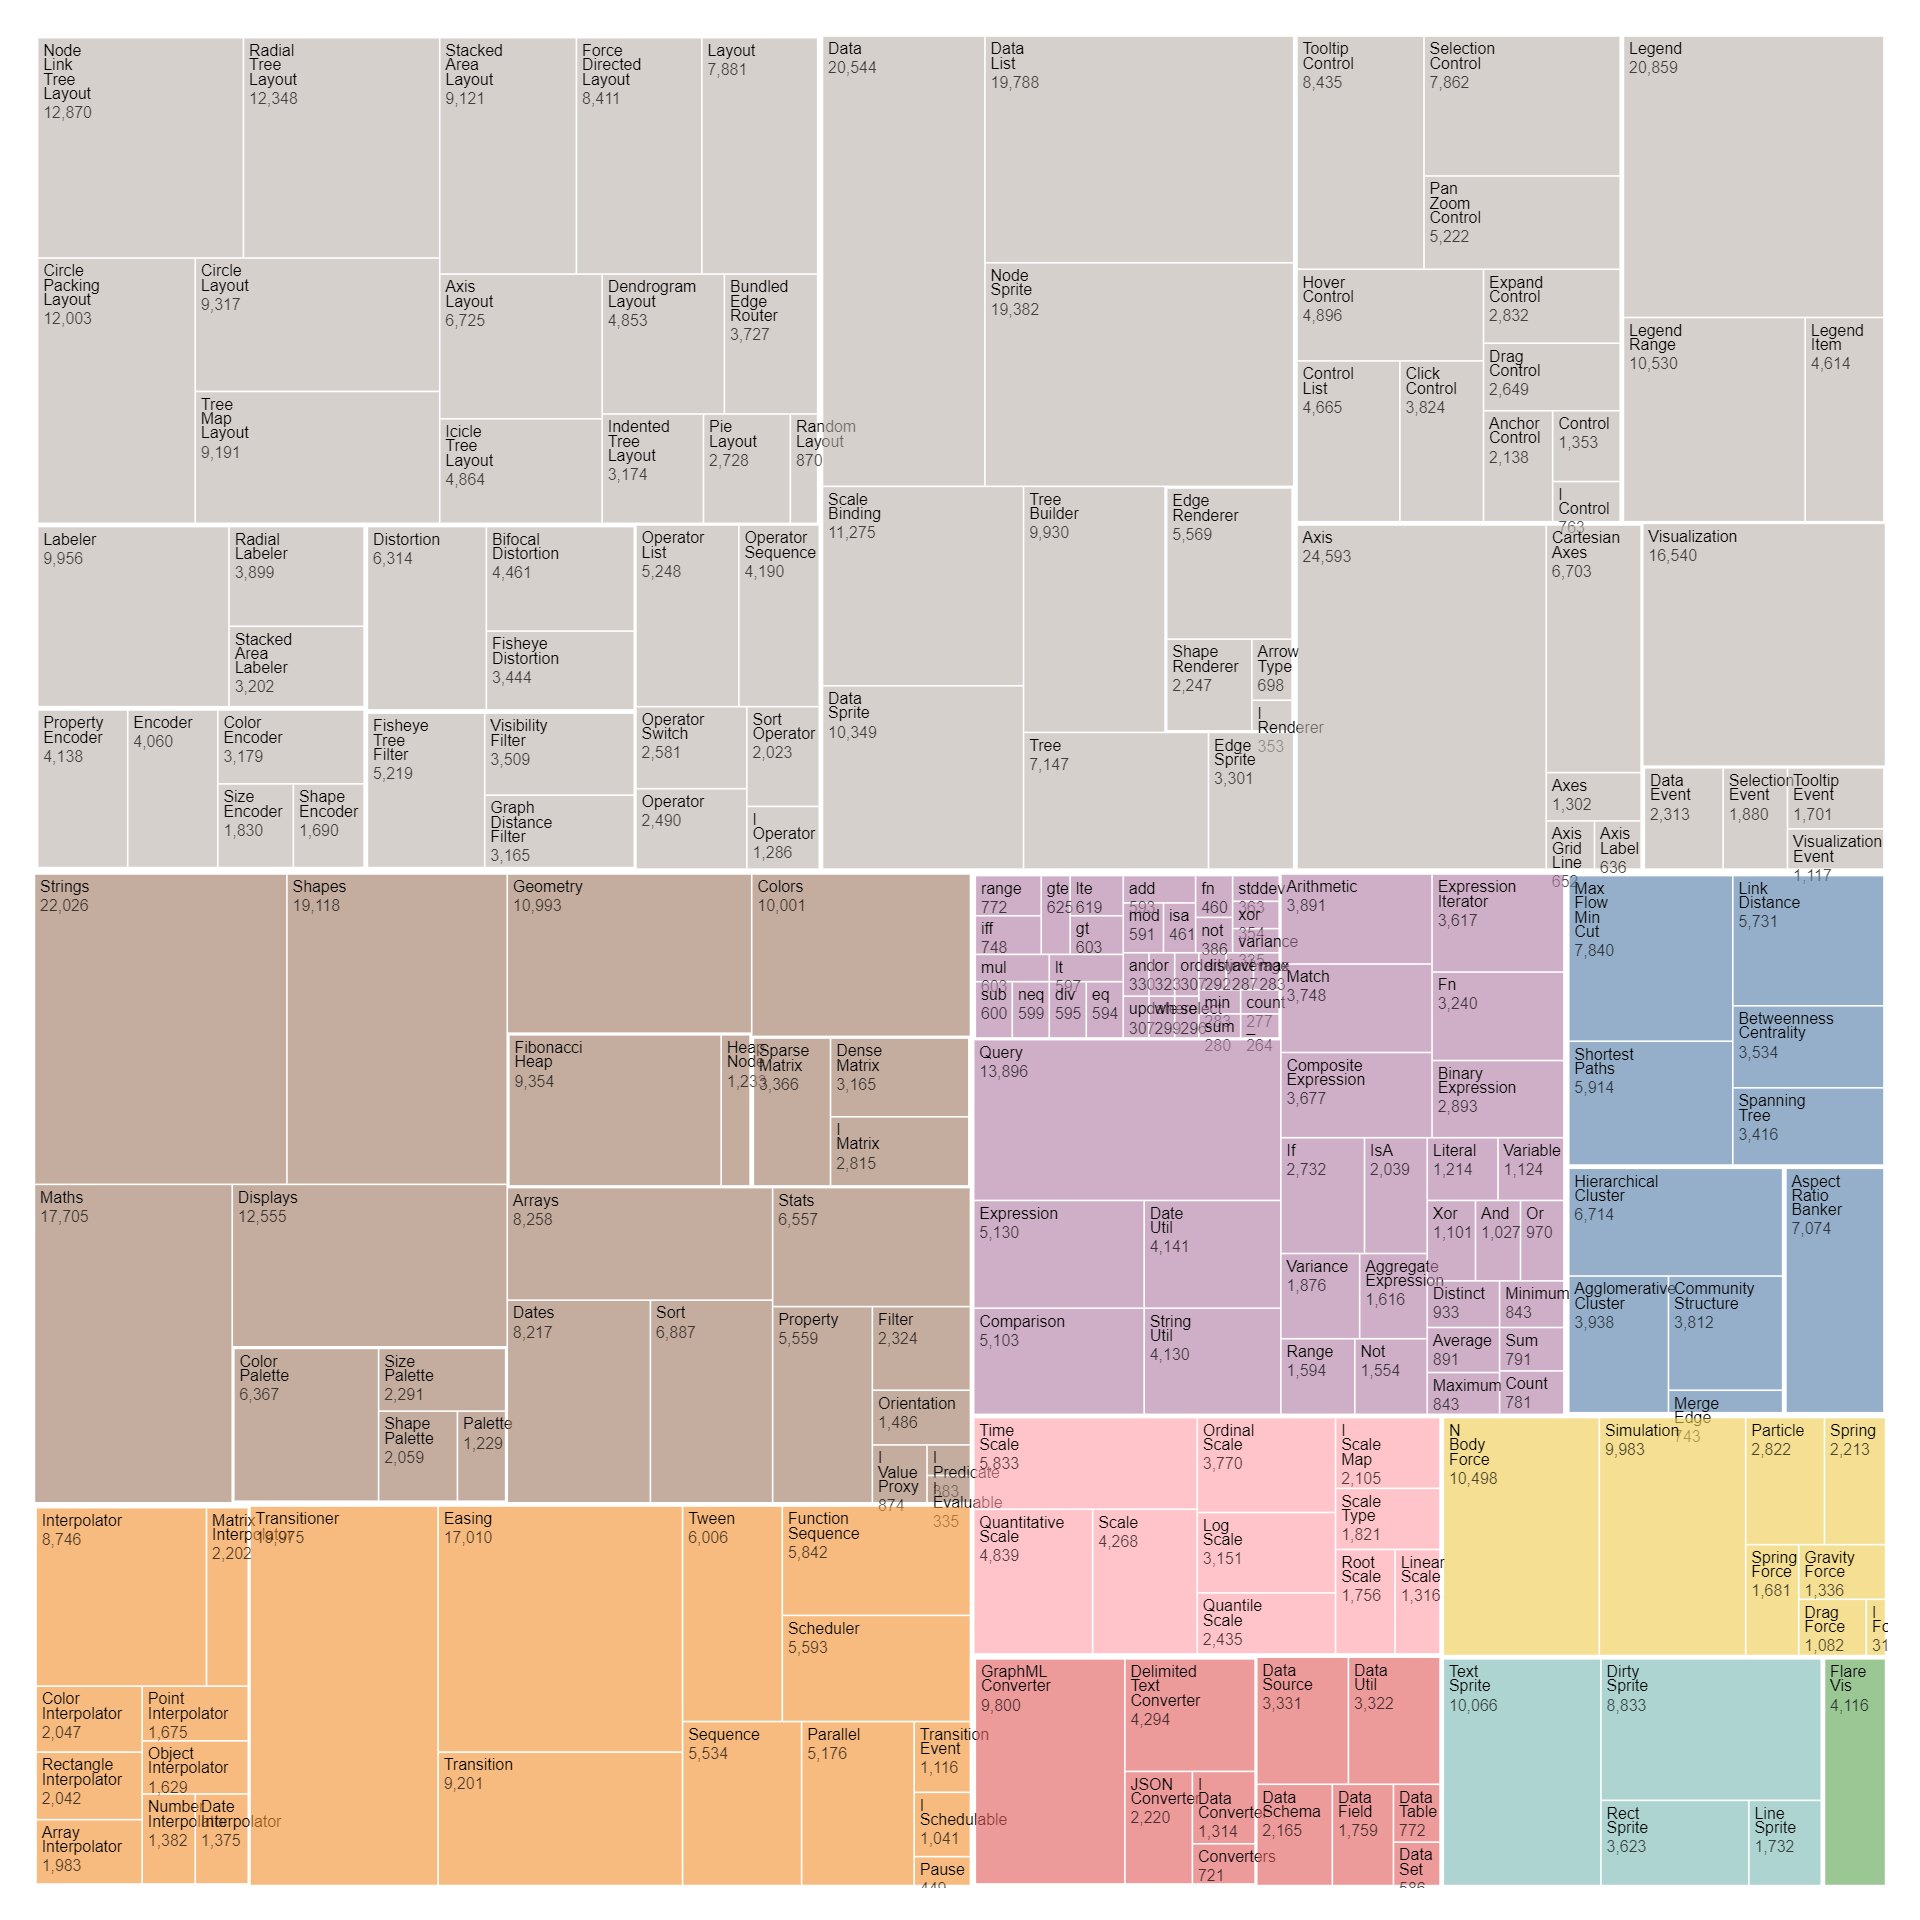
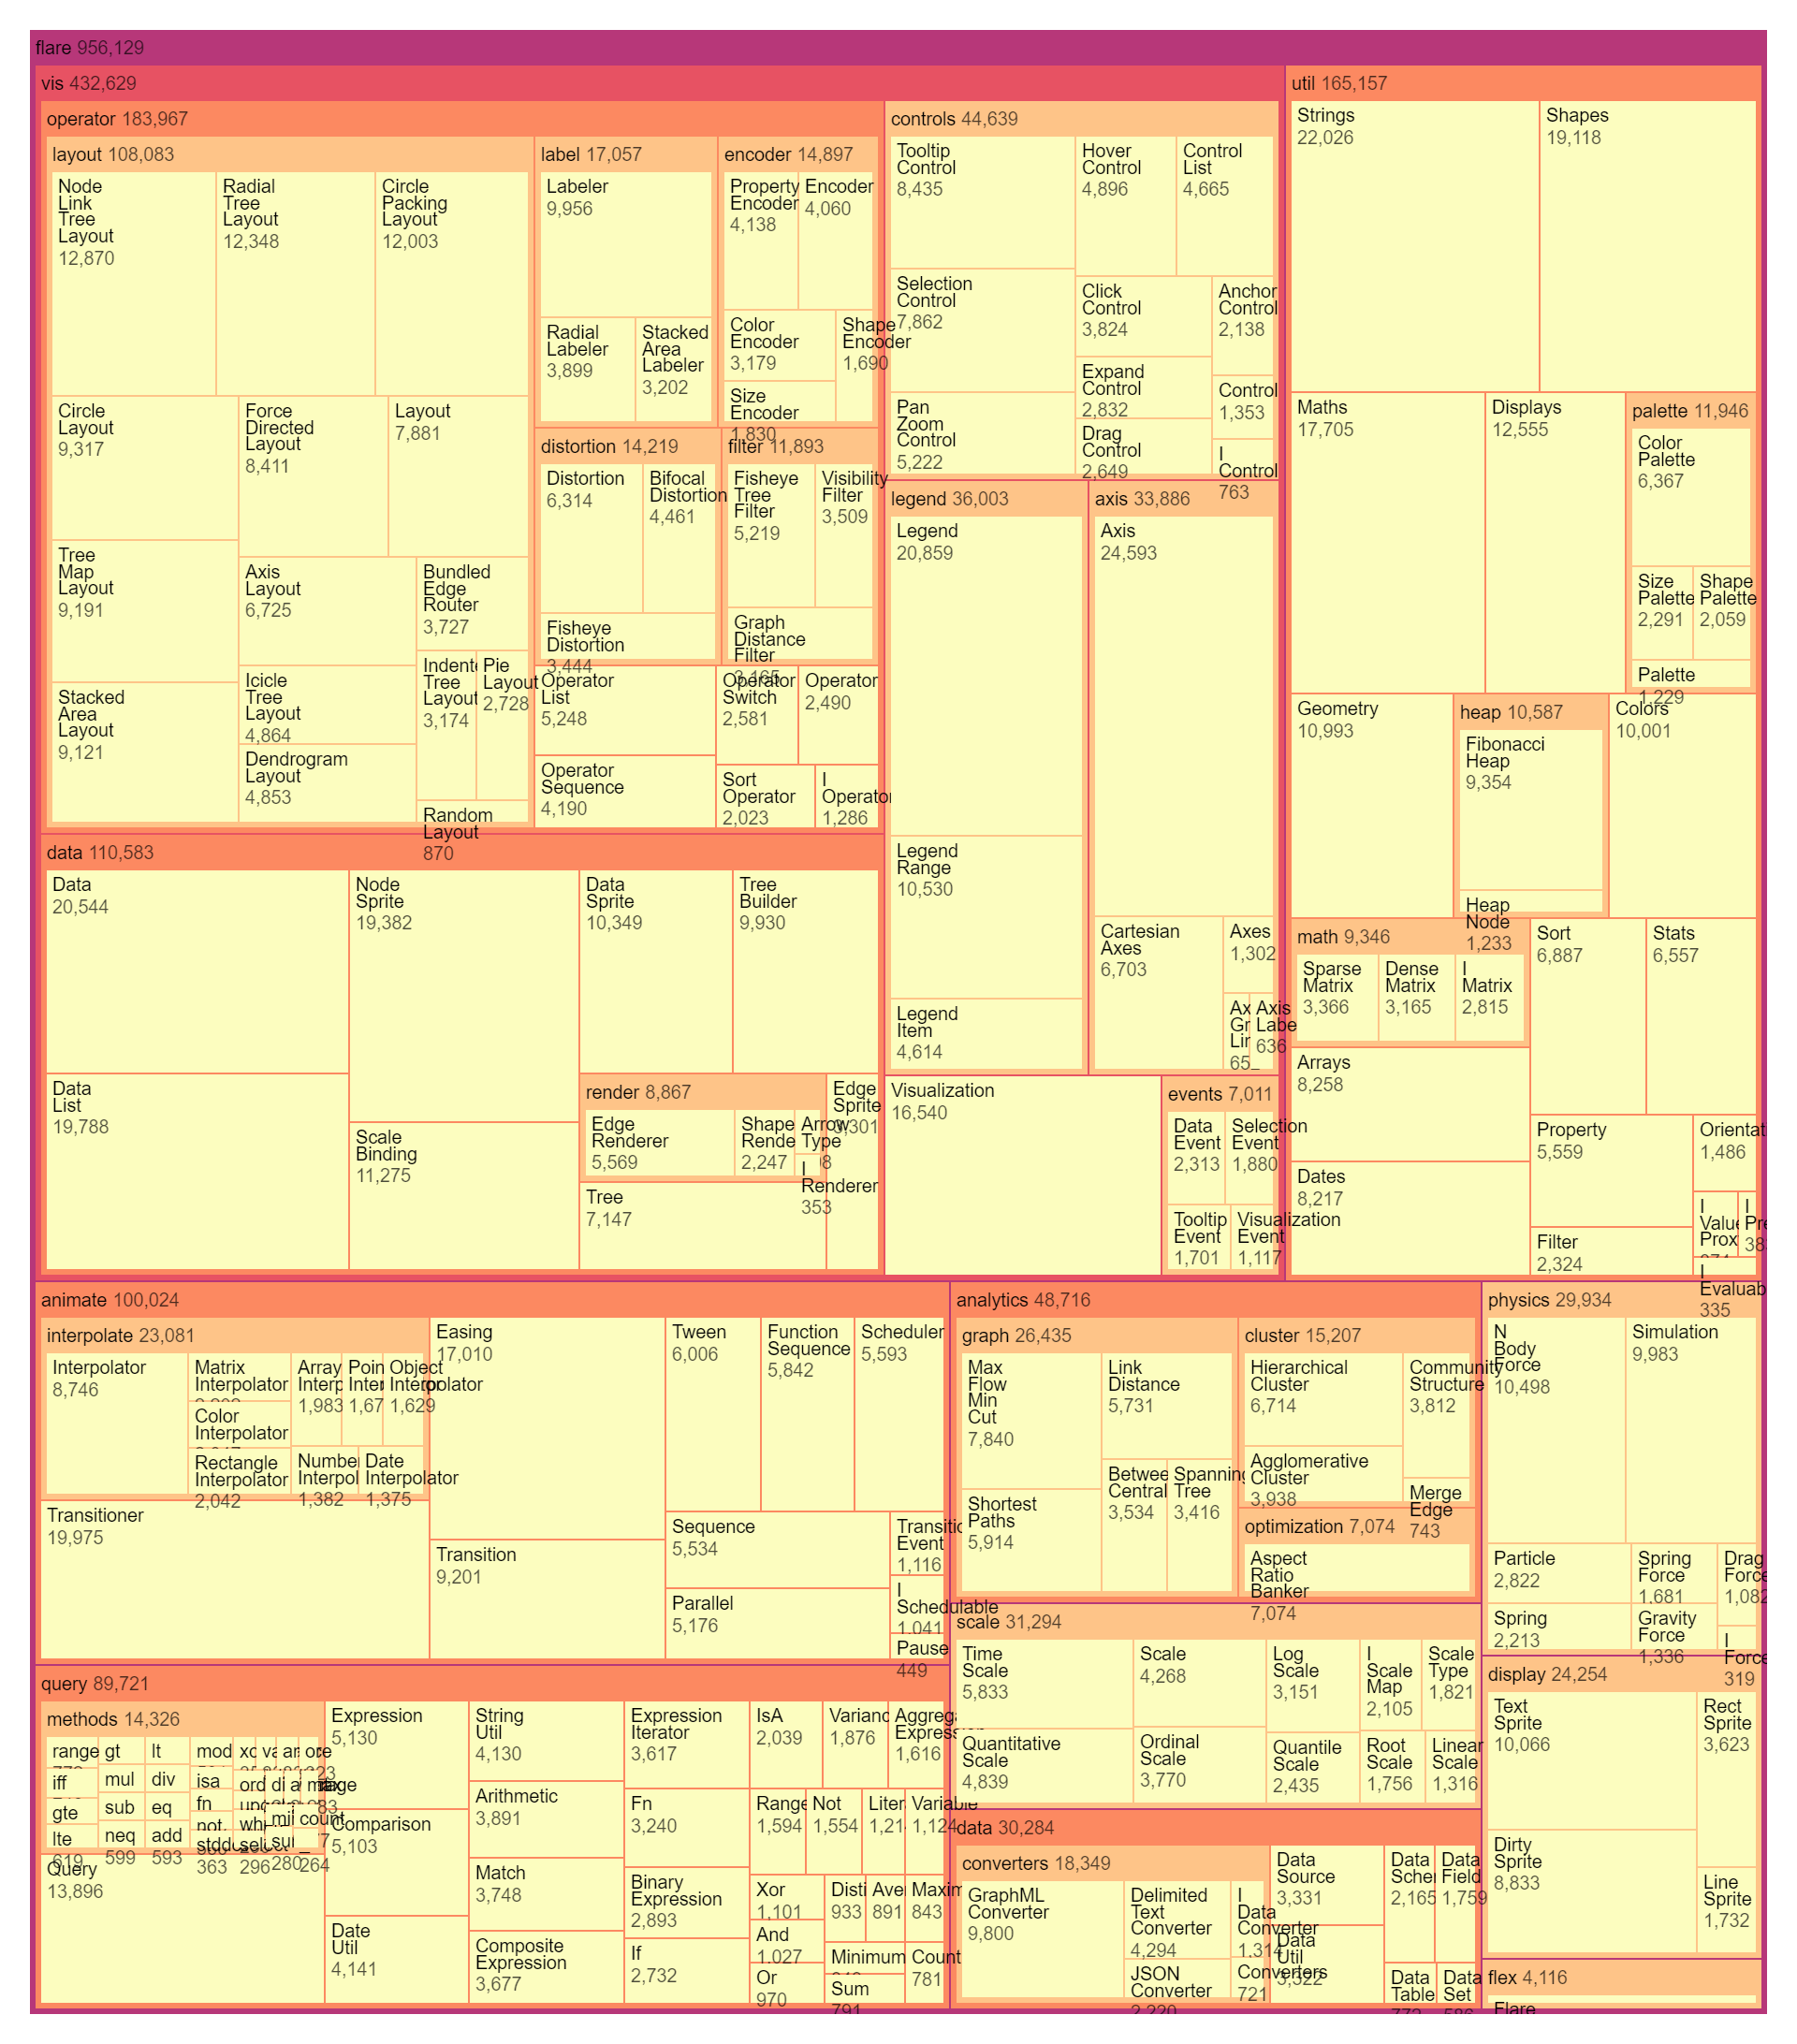
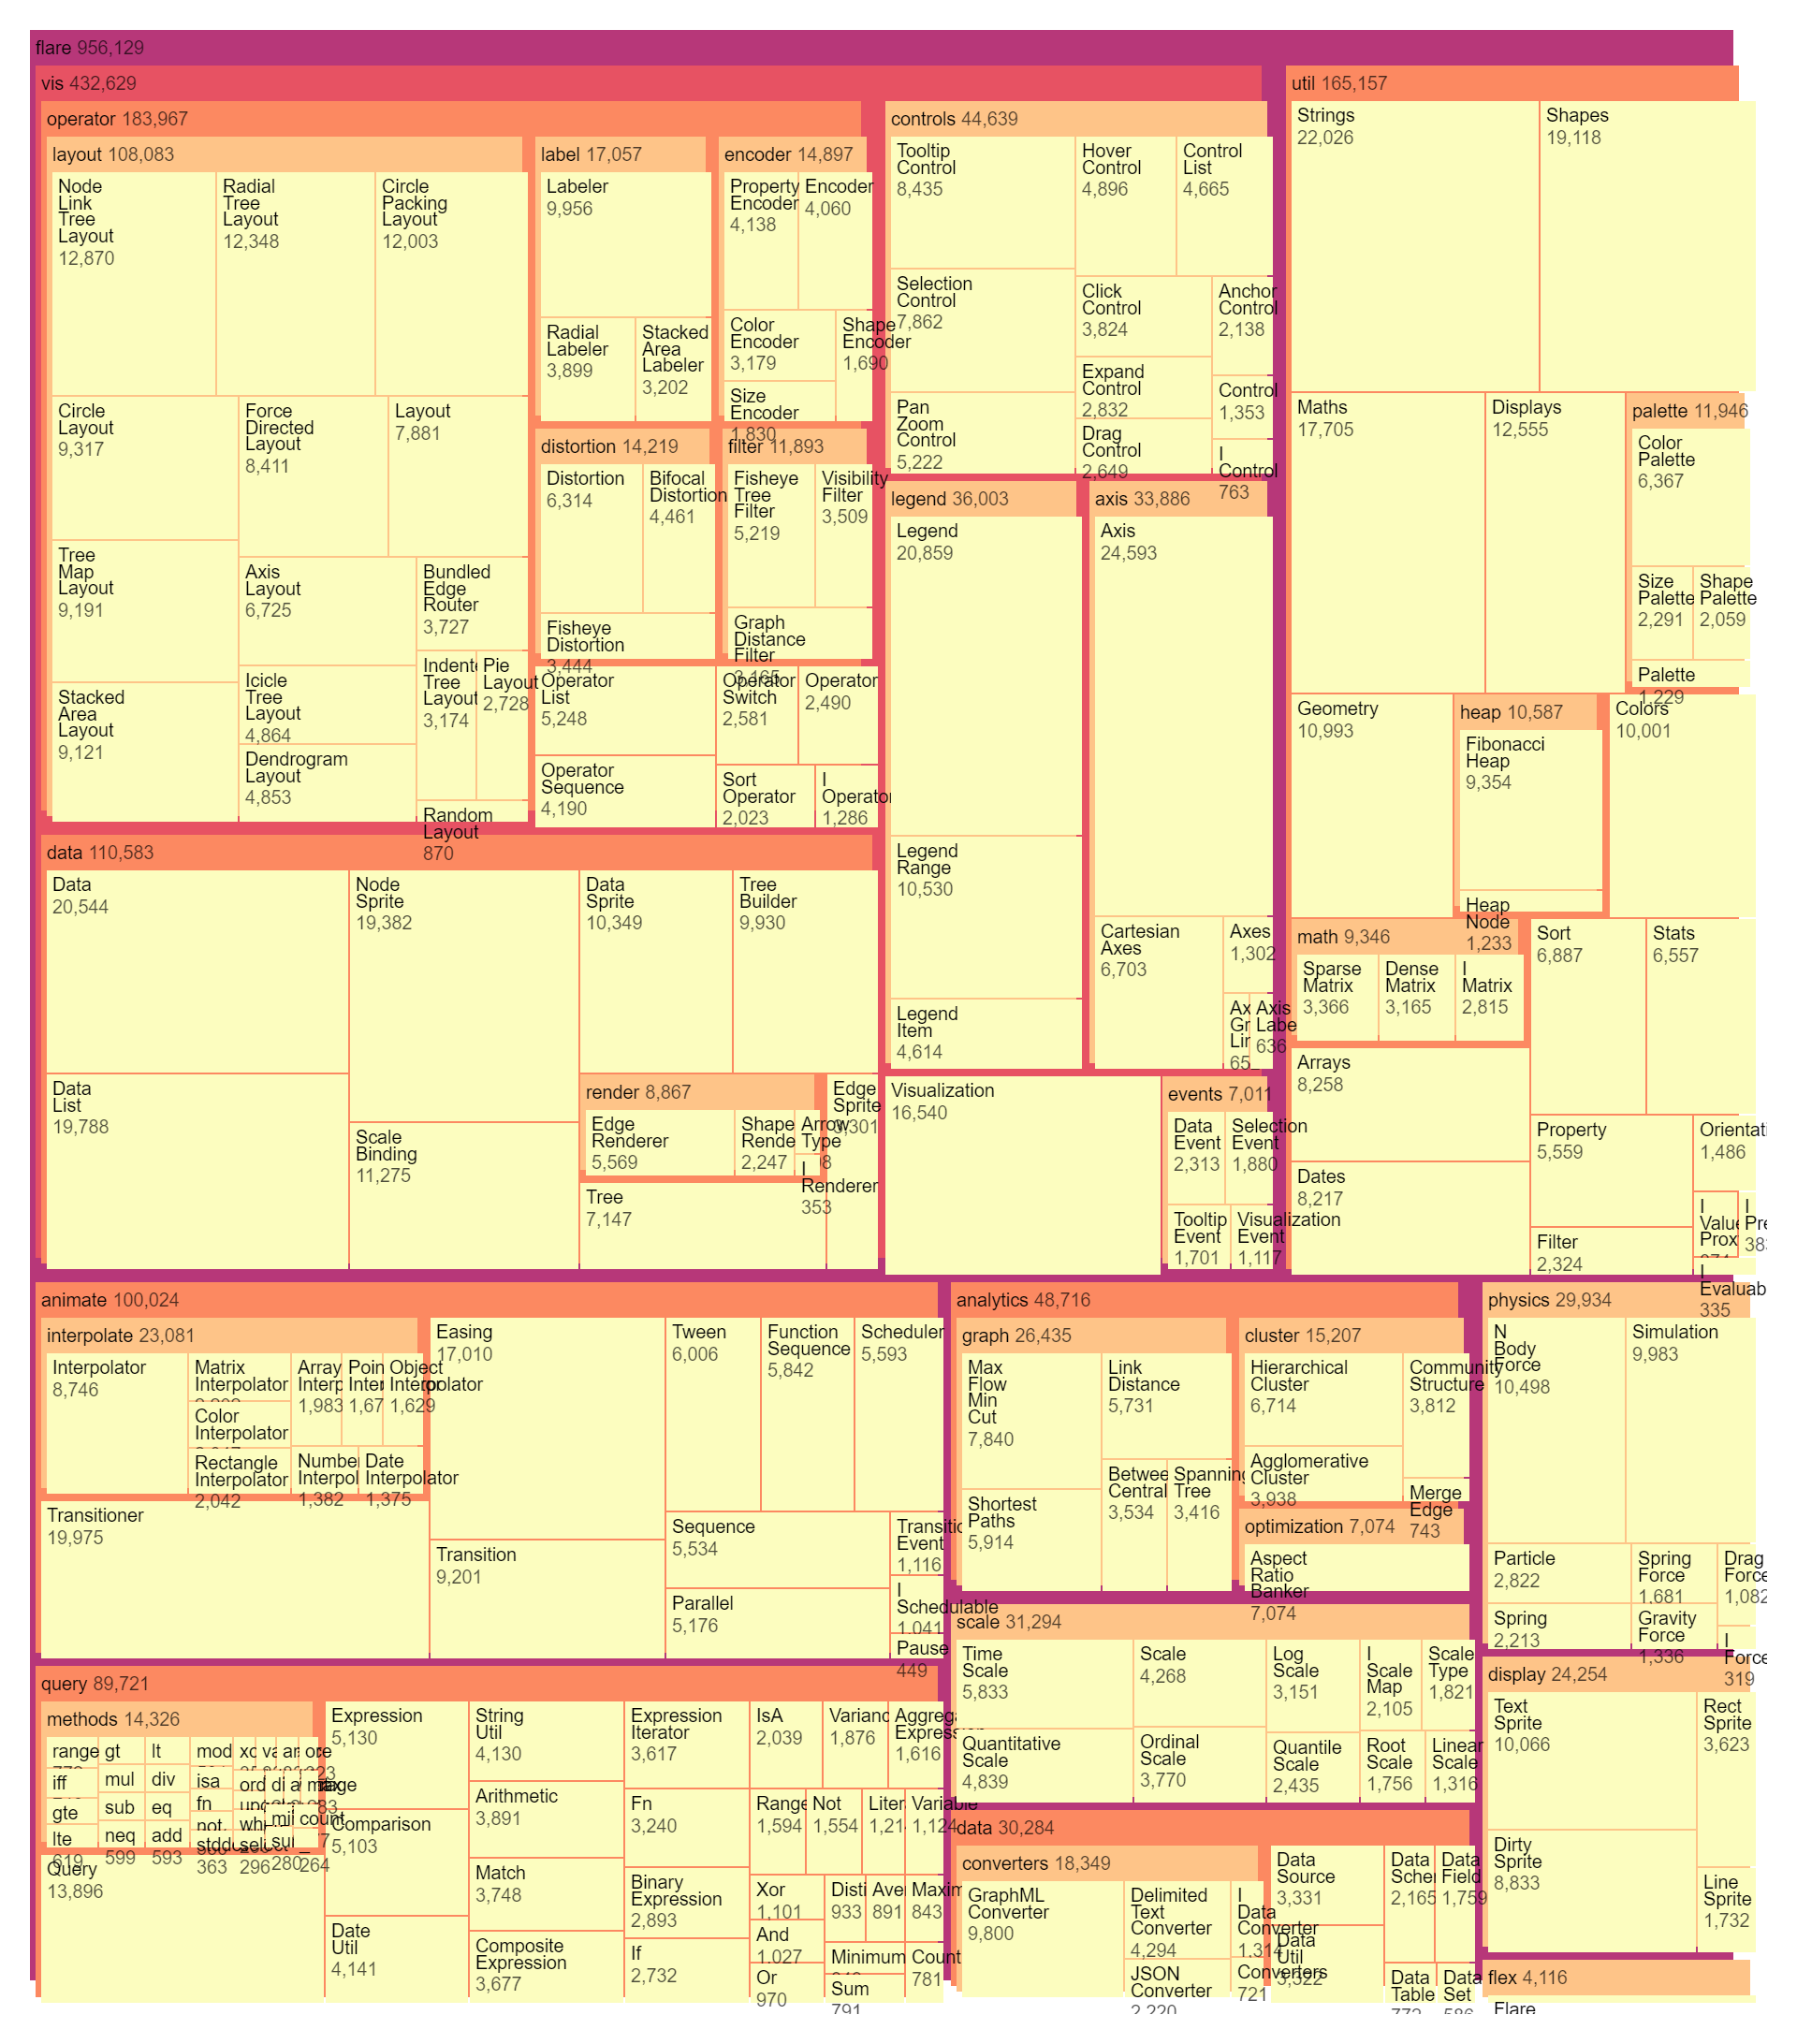
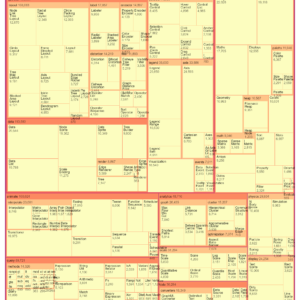
A Cascaded Treemap chart is a hierarchical data visualization tool that displays nested rectangles to represent hierarchical data structures. In this chart, each rectangle represents a node in the hierarchy, with the size of the rectangle proportional to a quantitative value associated with that node. The hierarchy is depicted by nesting rectangles within one another, with each level of the hierarchy represented by a separate layer or cascade of rectangles. Typically, the root node of the hierarchy is represented by the largest rectangle, and child nodes are represented by smaller rectangles nested within their parent nodes. The color of each rectangle may also encode additional information, such as category or value, to provide further insights into the data. Cascaded Treemap charts are useful for visualizing hierarchical relationships and analyzing the distribution of values within a hierarchy. They are commonly used in fields such as finance, where they can visualize portfolio allocations, and in data analysis, where they can represent organizational structures or product hierarchies. Additionally, Cascaded Treemap charts are effective for exploring and understanding complex data structures, as they provide a compact and intuitive representation of hierarchical relationships and data distributions.
Uses:
- Portfolio Analysis: These charts are used in finance to visualize portfolio allocations across different asset classes, sectors, or geographic regions.
- Organizational Structure: Cascaded Treemap charts help visualize hierarchical organizational structures, including departments, teams, and reporting relationships.
- Product Hierarchies: They are used in retail and manufacturing to visualize product hierarchies, including categories, subcategories, and product lines.
- Website Navigation: Cascaded Treemap charts aid in designing and optimizing website navigation by visualizing site structure and page hierarchies.
- Resource Allocation: They assist in visualizing resource allocations, such as budget, manpower, or equipment, across different projects, departments, or initiatives.
- Market Analysis: These charts are used in market analysis to visualize market segmentation, including customer demographics, preferences, and purchasing behavior.
- Supply Chain Management: Cascaded Treemap charts help visualize supply chain networks, including suppliers, manufacturers, distributors, and retailers.
- Data Classification: They aid in data classification by visualizing hierarchical relationships between data categories, attributes, and subgroups.
- Geospatial Data: These charts can be used to visualize hierarchical geospatial data, such as administrative boundaries, land use categories, or ecological zones.
- Process Visualization: Cascaded Treemap charts are used to visualize hierarchical processes, including workflow diagrams, decision trees, and organizational workflows.
Purposes:
- Hierarchical Visualization: The primary purpose of Cascaded Treemap charts is to visualize hierarchical relationships and structures in data.
- Data Exploration: They support data exploration by enabling users to interactively explore hierarchical data structures and relationships.
- Pattern Recognition: Cascaded Treemap charts help identify patterns, trends, and anomalies within hierarchical data sets.
- Comparison: They facilitate comparison of hierarchical data structures across different dimensions, levels, or categories.
- Resource Optimization: These charts assist in optimizing resource allocation and utilization by visualizing hierarchical resource distributions.
- Decision Support: Cascaded Treemap charts provide insights to support decision-making processes related to resource allocation, portfolio management, and organizational planning.
- Communication: They serve as communication tools for presenting complex hierarchical data structures in a visually intuitive format.
- Forecasting: These charts aid in forecasting future trends and developments based on historical hierarchical data patterns.
- Problem Solving: Cascaded Treemap charts help identify and solve problems related to data organization, classification, and analysis.
- Knowledge Discovery: They facilitate knowledge discovery by revealing insights, relationships, and trends within complex hierarchical data sets.
Only logged in customers who have purchased this product may leave a review.
Related products
-
- Sale!
Radial Tidy Tree
- Original price was: $ 15.$ 10Current price is: $ 10.
- Add to cart
-
- Sale!
Nested Tree Map
- Original price was: $ 15.$ 10Current price is: $ 10.
- Add to cart
-
- Sale!
Indented Tree
- Original price was: $ 15.$ 10Current price is: $ 10.
- Add to cart
Reviews
There are no reviews yet.