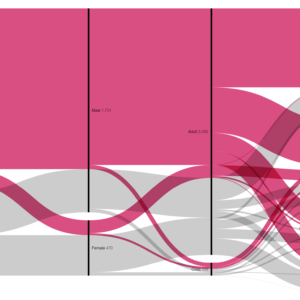
A Circle Packing chart is a data visualization technique that represents hierarchical data using nested circles. In this chart, each circle represents a node in the hierarchy, and the size of the circle corresponds to a quantitative value associated with that node. The circles are nested within one another, with child nodes represented by smaller circles nested within their parent circles. The hierarchy is visually depicted by the placement and size of the circles, with the root node typically represented by the largest circle at the center of the chart. Circle Packing charts are effective for visualizing hierarchical relationships and analyzing the distribution of values within a hierarchy. They provide an intuitive representation of complex hierarchical structures, allowing users to quickly grasp the relative sizes and relationships between different nodes in the hierarchy. Additionally, Circle Packing charts can be interactive, allowing users to explore and interact with the hierarchical data by zooming in or clicking on individual circles to reveal more detailed information. These charts are commonly used in fields such as data analysis, biology, and finance, where hierarchical relationships are prevalent and understanding the structure of the data is essential for analysis and decision-making.
Uses:
- Hierarchical Data Visualization: Circle Packing charts are used to visualize hierarchical data structures, representing nodes as circles nested within one another.
- Portfolio Analysis: They are employed in finance to visualize portfolio allocations across different asset classes, sectors, or geographic regions.
- Organizational Structure: Circle Packing charts help visualize hierarchical organizational structures, including departments, teams, and reporting relationships.
- Product Hierarchies: They are used in retail and manufacturing to visualize product hierarchies, including categories, subcategories, and product lines.
- Website Navigation: Circle Packing charts aid in designing and optimizing website navigation by visualizing site structure and page hierarchies.
- Resource Allocation: They assist in visualizing resource allocations, such as budget, manpower, or equipment, across different projects, departments, or initiatives.
- Market Analysis: Circle Packing charts are used in market analysis to visualize market segmentation, including customer demographics, preferences, and purchasing behavior.
- Supply Chain Management: They help visualize supply chain networks, including suppliers, manufacturers, distributors, and retailers.
- Data Classification: Circle Packing charts aid in data classification by visualizing hierarchical relationships between data categories, attributes, and subgroups.
- Geospatial Data: These charts can be used to visualize hierarchical geospatial data, such as administrative boundaries, land use categories, or ecological zones.
Purposes:
- Hierarchical Visualization: The primary purpose of Circle Packing charts is to visualize hierarchical relationships and structures in data.
- Data Exploration: They support data exploration by enabling users to interactively explore hierarchical data structures and relationships.
- Pattern Recognition: Circle Packing charts help identify patterns, trends, and anomalies within hierarchical data sets.
- Comparison: They facilitate comparison of hierarchical data structures across different dimensions, levels, or categories.
- Resource Optimization: These charts assist in optimizing resource allocation and utilization by visualizing hierarchical resource distributions.
- Decision Support: Circle Packing charts provide insights to support decision-making processes related to resource allocation, portfolio management, and organizational planning.
- Communication: They serve as communication tools for presenting complex hierarchical data structures in a visually intuitive format.
- Forecasting: These charts aid in forecasting future trends and developments based on historical hierarchical data patterns.
- Problem Solving: Circle Packing charts help identify and solve problems related to data organization, classification, and analysis.
- Knowledge Discovery: They facilitate knowledge discovery by revealing insights, relationships, and trends within complex hierarchical data sets.

Reviews
There are no reviews yet.