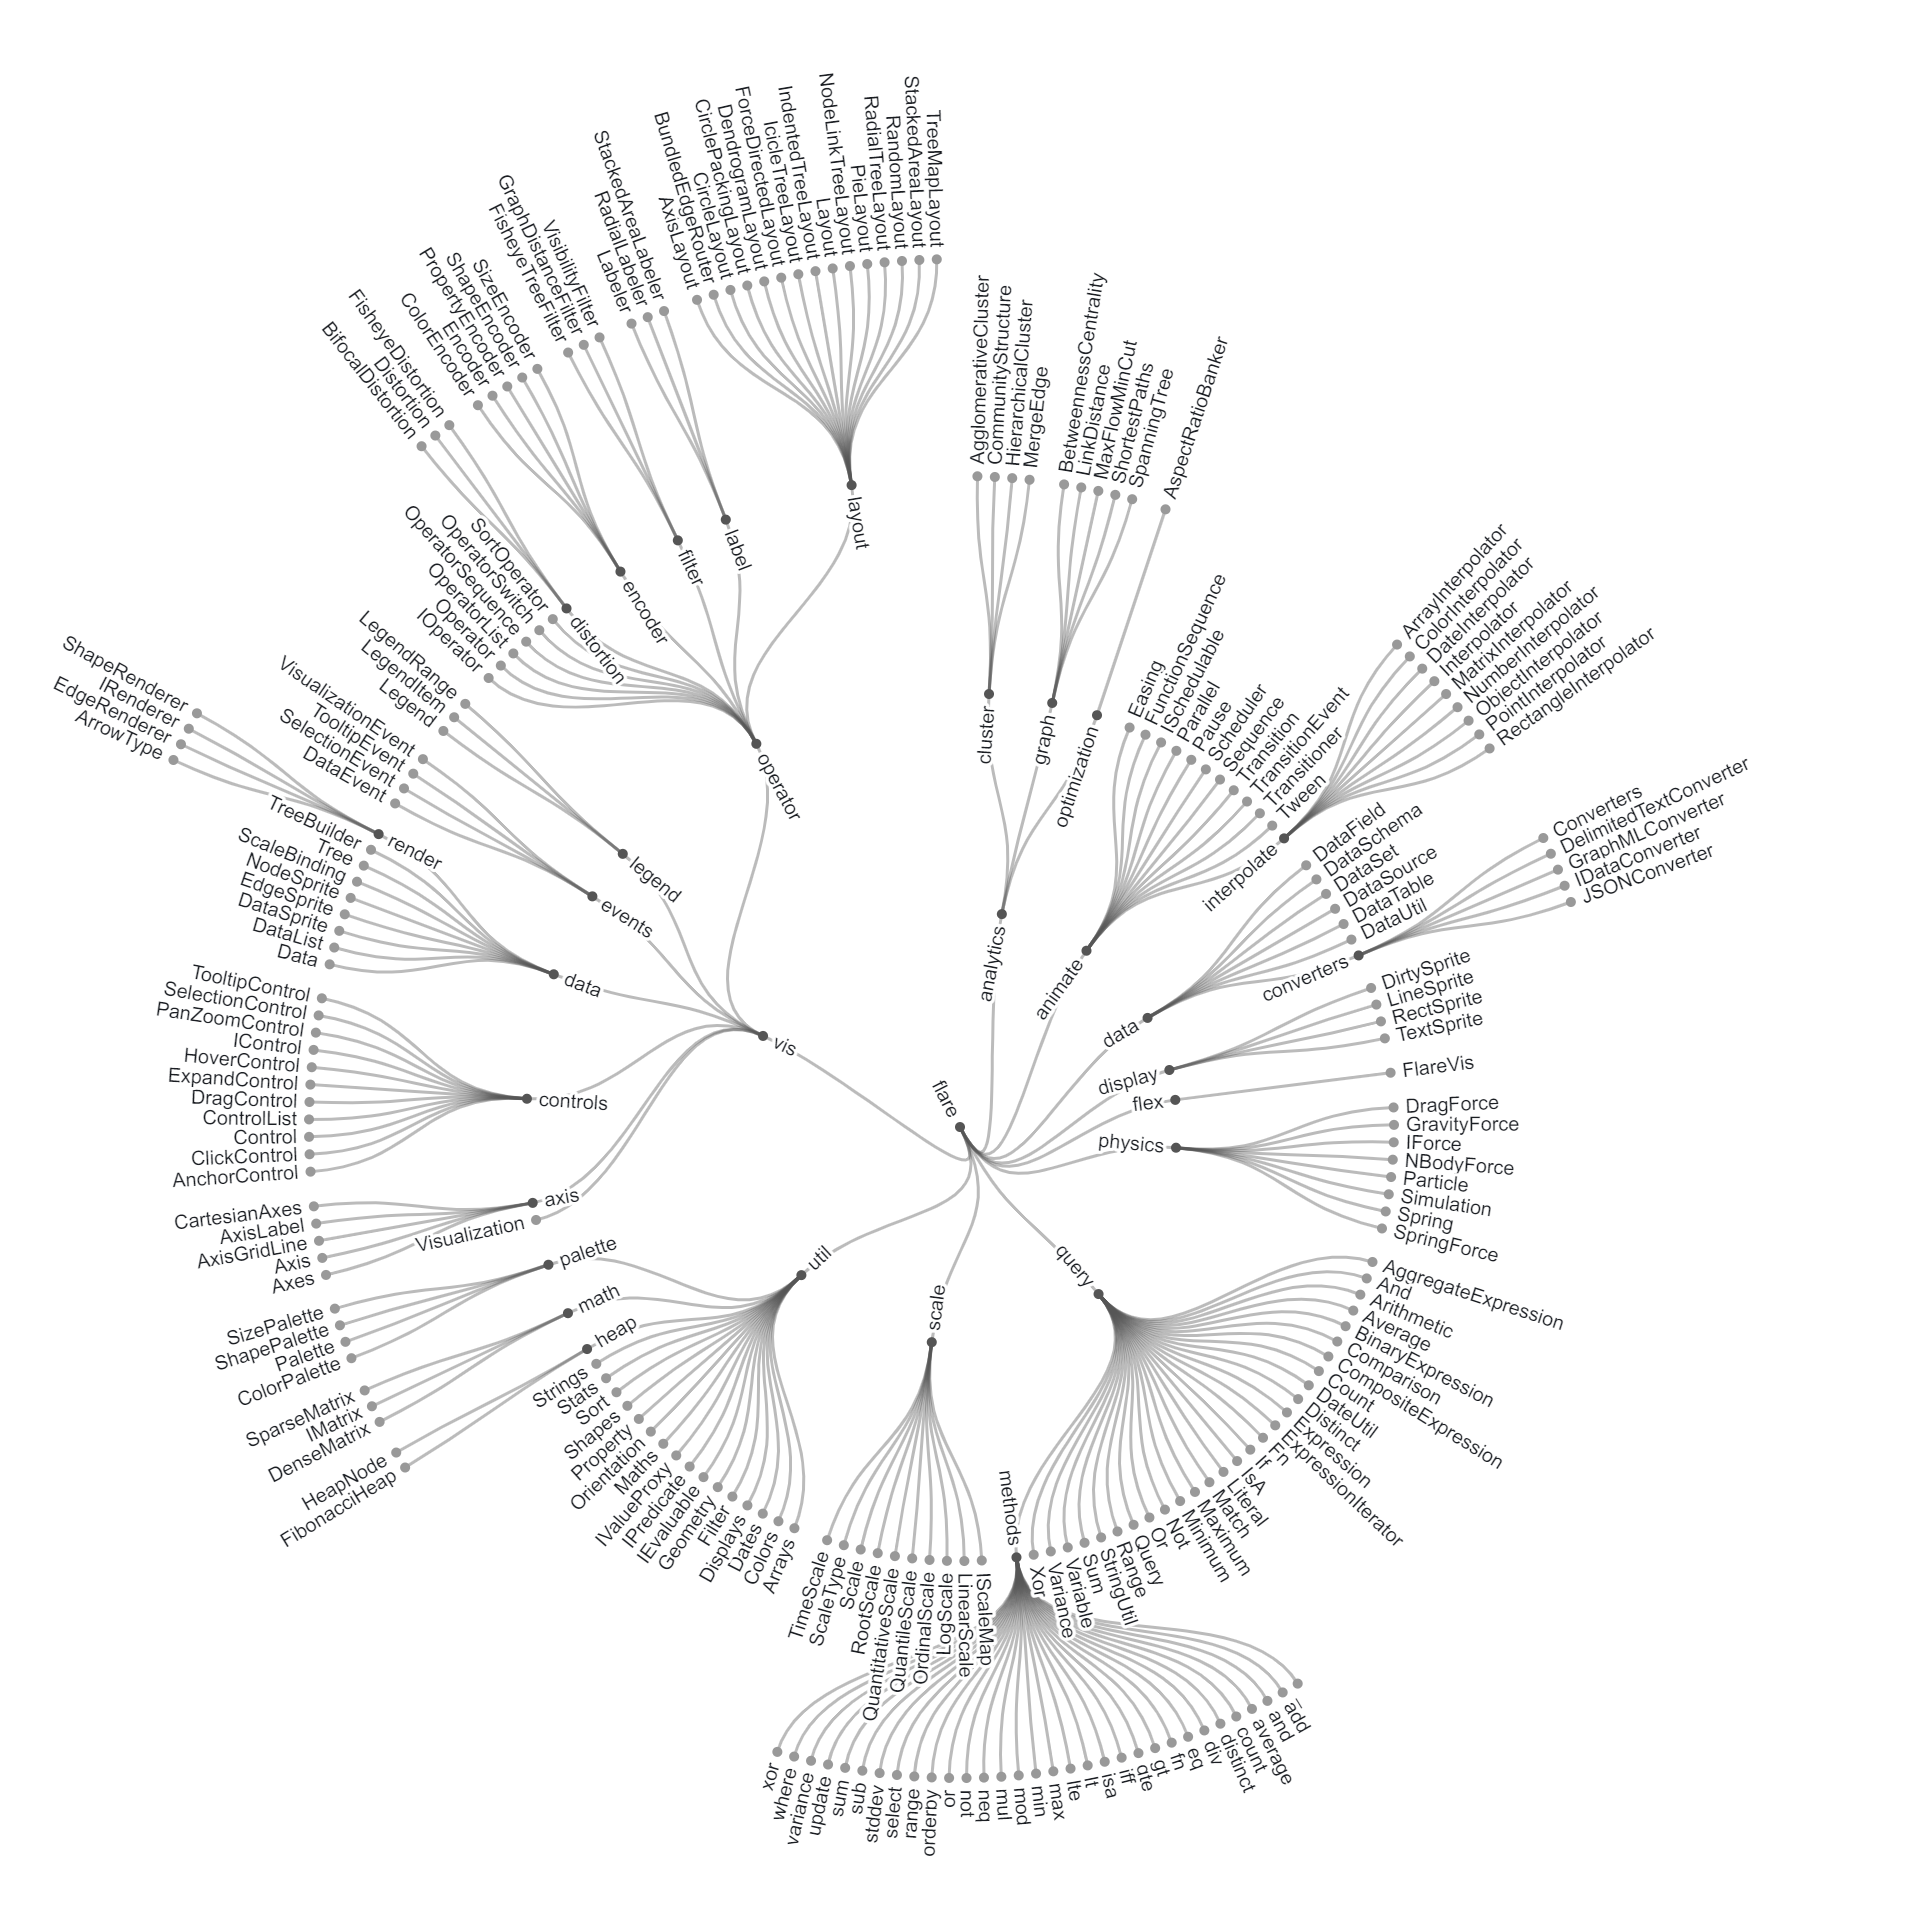
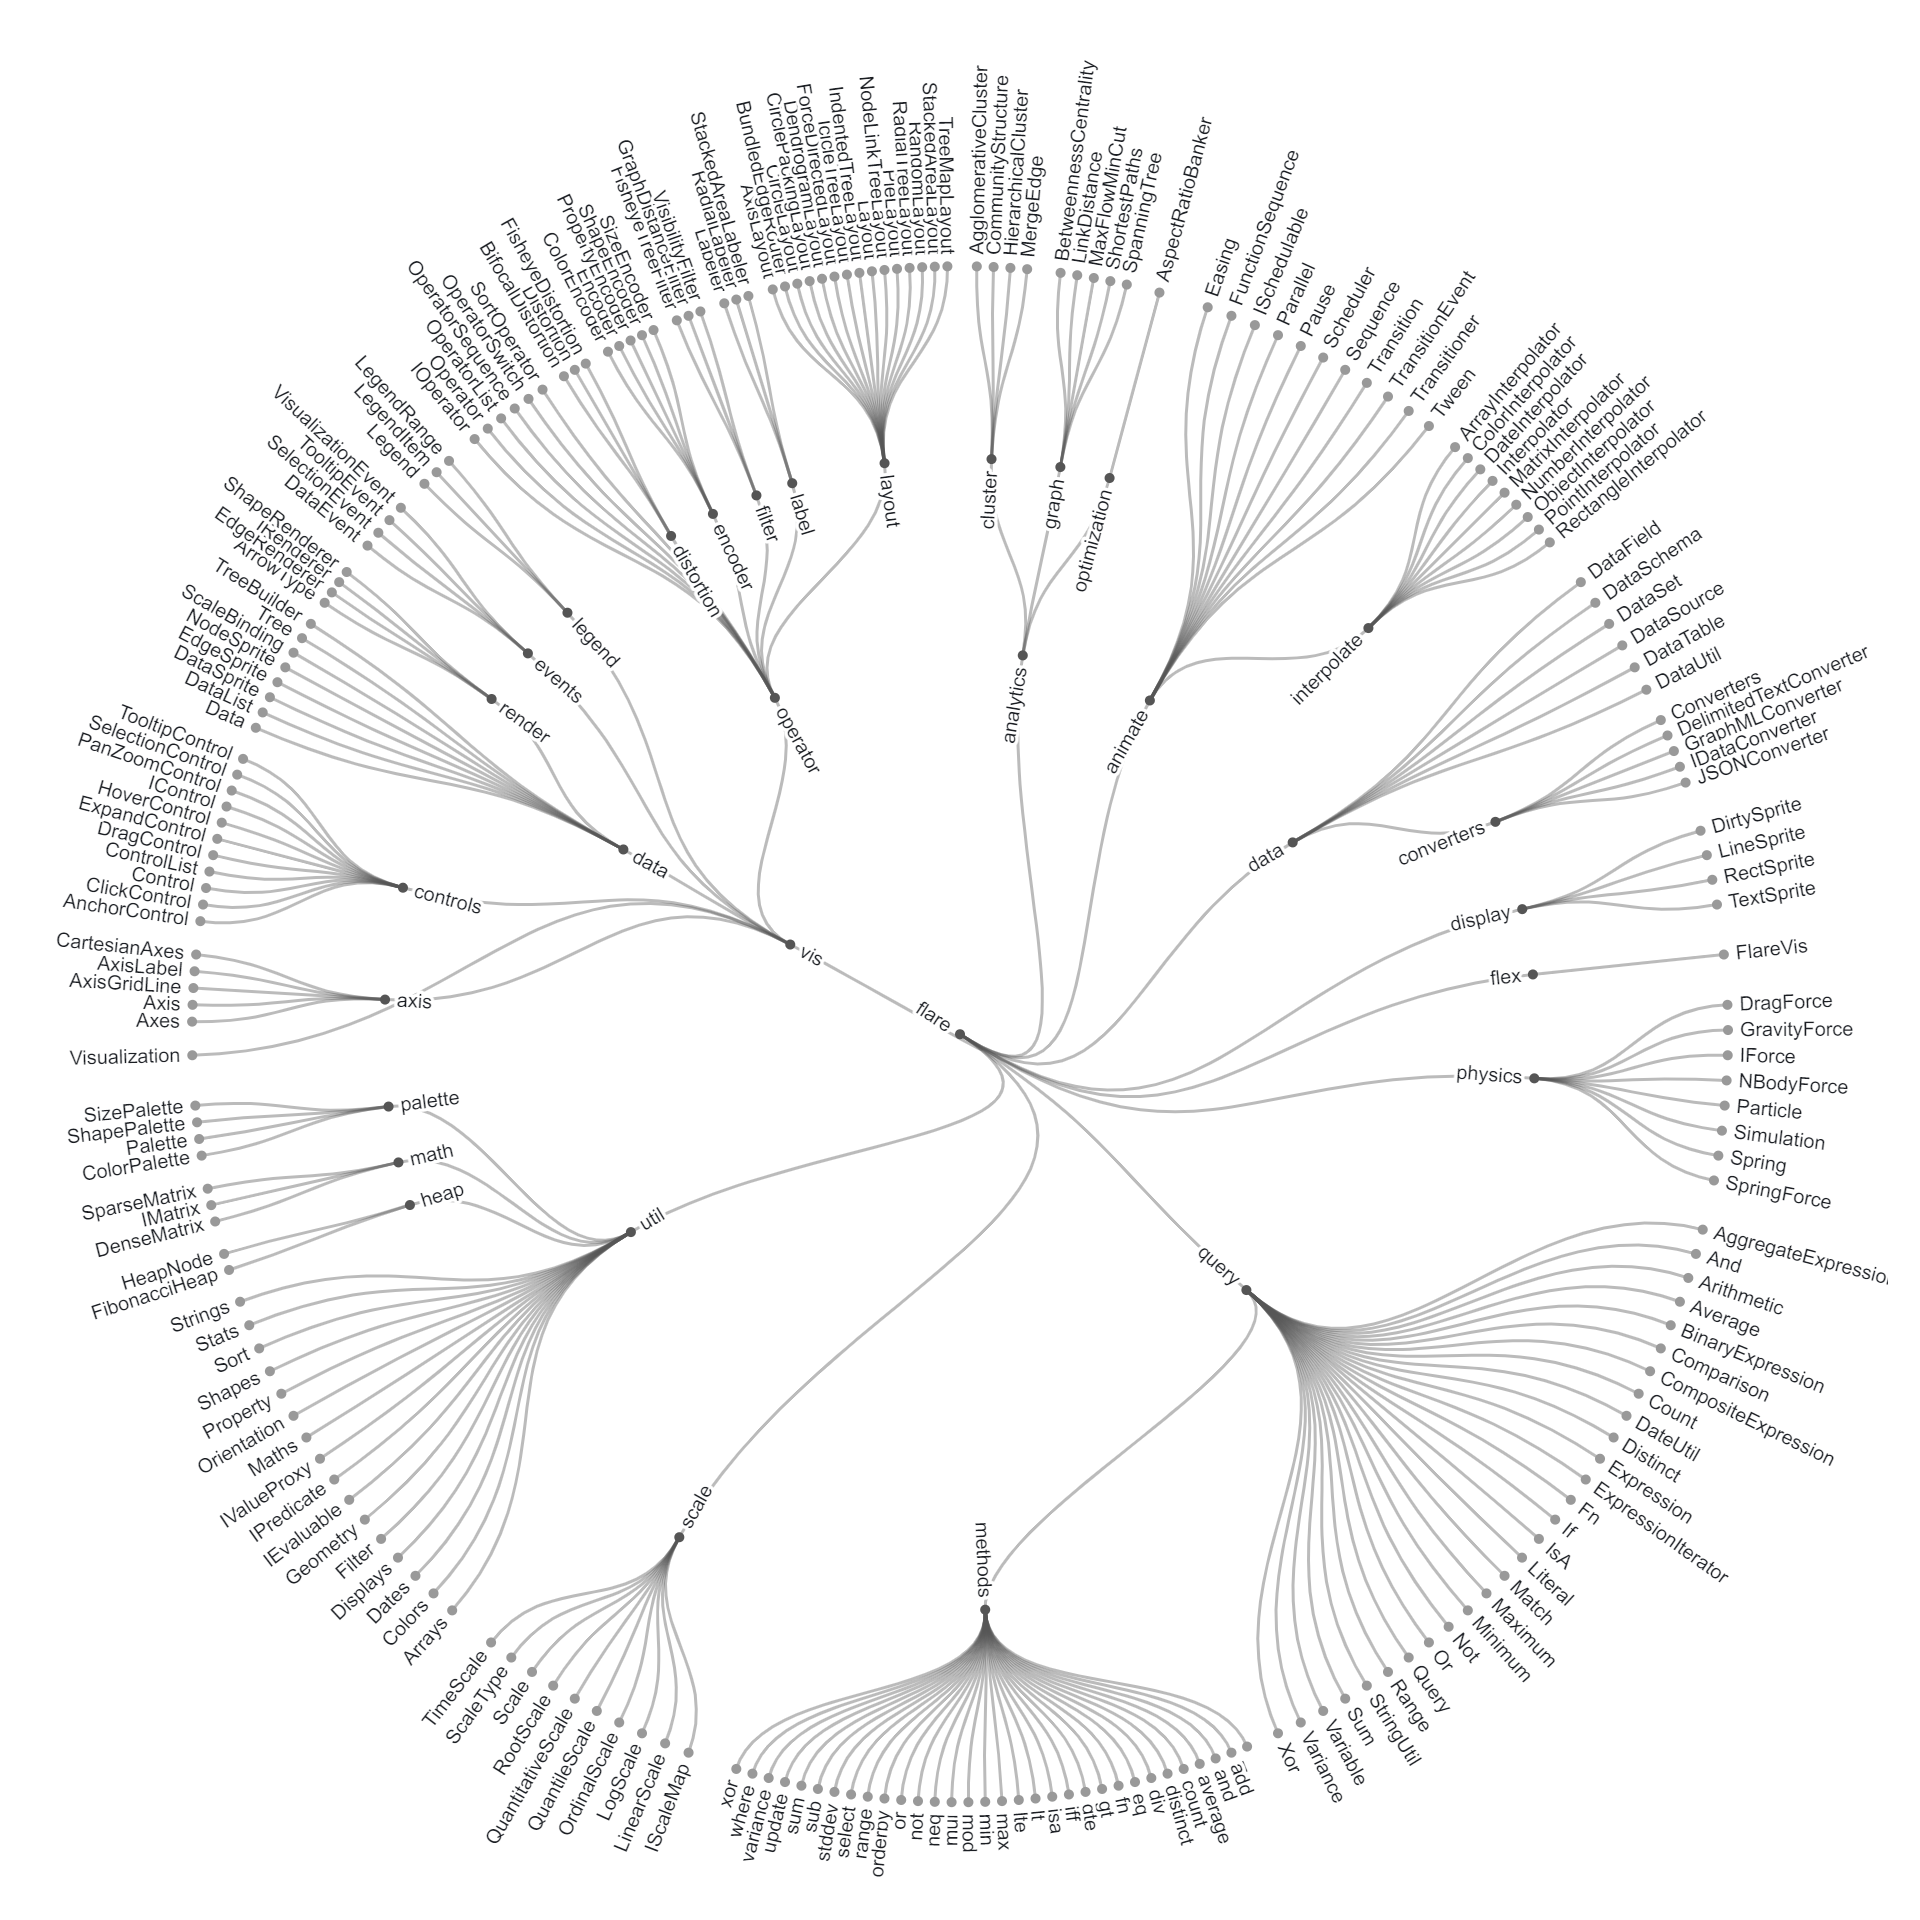
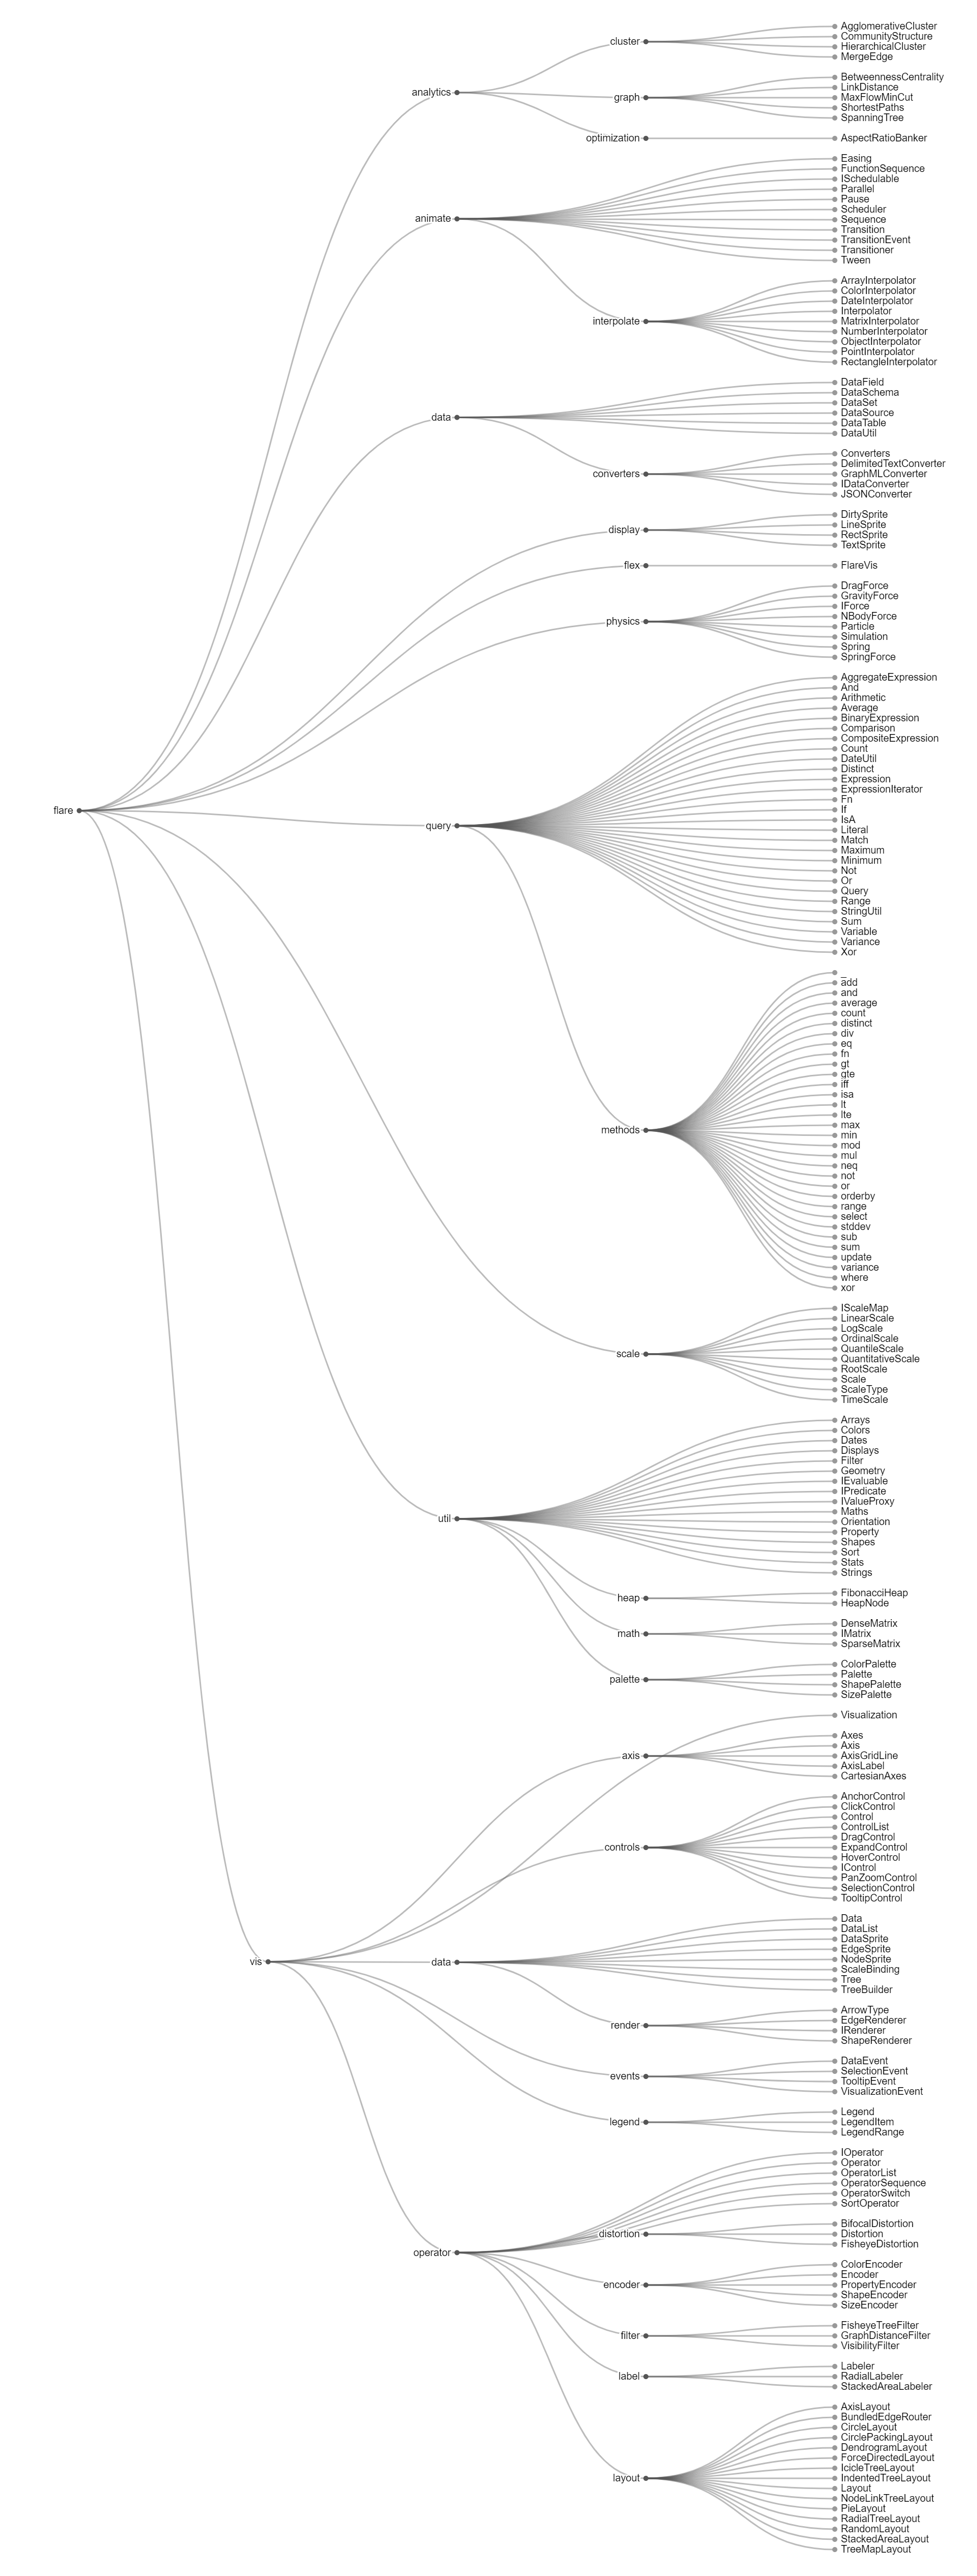
Description
A Cluster Dendrogram chart is a hierarchical data visualization tool used to represent relationships between data points or entities. In this chart, data points are represented as leaves on a tree-like structure, with branches connecting similar data points together based on their similarity or dissimilarity. The height of each branch in the dendrogram represents the distance or dissimilarity between the clustered data points. The dendrogram is typically constructed using hierarchical clustering algorithms, which recursively group data points into clusters based on their proximity to one another. As the clustering algorithm progresses, clusters are merged together until all data points are contained within a single cluster at the top of the dendrogram. Cluster Dendrogram charts are commonly used in fields such as biology, where they are used to analyze genetic relationships between species or organisms, and in data analysis, where they are used to identify clusters or groups within datasets. They provide a visual representation of hierarchical clustering results, allowing users to identify clusters, outliers, and relationships between data points. Additionally, Cluster Dendrogram charts can be interactive, allowing users to explore and interact with the hierarchical clustering results by expanding or collapsing branches to reveal more detailed information about the data clusters.
Uses:
- Hierarchical Data Analysis: Cluster Dendrogram charts are used to analyze hierarchical relationships between data points or entities.
- Genetic Analysis: They are employed in biology to analyze genetic relationships between species, organisms, or genes.
- Market Segmentation: Cluster Dendrogram charts aid in market segmentation analysis by identifying clusters or groups of customers with similar characteristics or preferences.
- Customer Segmentation: They assist in customer segmentation analysis by grouping customers based on their purchasing behavior, demographics, or preferences.
- Product Categorization: Cluster Dendrogram charts are used in retail to categorize products based on their attributes, features, or sales patterns.
- Text Analysis: They are employed in natural language processing to cluster text documents based on their content or semantic similarity.
- Image Segmentation: Cluster Dendrogram charts aid in image segmentation analysis by grouping similar image regions or pixels together.
- Social Network Analysis: They assist in analyzing social networks by identifying communities or groups of users with similar connections or interactions.
- Healthcare Analytics: Cluster Dendrogram charts are used in healthcare analytics to analyze patient populations, identify disease clusters, or group patients based on their medical profiles.
- Fraud Detection: They aid in fraud detection analysis by clustering transactions or activities based on their suspiciousness or similarity to known fraudulent patterns.
Purposes:
- Clustering: The primary purpose of Cluster Dendrogram charts is to perform clustering analysis, grouping data points into clusters based on their similarity or dissimilarity.
- Pattern Recognition: They help recognize patterns, trends, or clusters within datasets by visualizing hierarchical relationships between data points.
- Anomaly Detection: Cluster Dendrogram charts aid in detecting outliers or anomalies within datasets by identifying data points that do not fit within any cluster.
- Data Exploration: They support data exploration by enabling users to interactively explore hierarchical clustering results and discover insights within datasets.
- Comparison: Cluster Dendrogram charts facilitate comparison of different clustering results or algorithms by visualizing the hierarchical relationships between data points.
- Segmentation: They assist in segmenting datasets into meaningful groups or categories based on their hierarchical structure.
- Classification: Cluster Dendrogram charts aid in classifying data points into groups or categories based on their similarity to one another.
- Decision Support: They provide insights to support decision-making processes related to resource allocation, marketing strategies, or business planning based on clustering analysis results.
- Knowledge Discovery: Cluster Dendrogram charts facilitate knowledge discovery by revealing insights, relationships, or clusters within datasets that may not be apparent from raw data.
- Visualization: They serve as visualization tools for presenting clustering analysis results in a visually intuitive and interpretable format.
Only logged in customers who have purchased this product may leave a review.
Related products
-
- Sale!
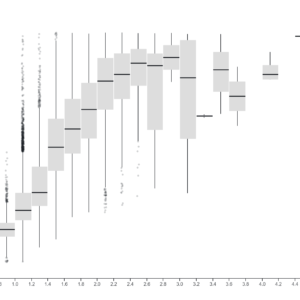
Box plot
- Original price was: $ 15.$ 10Current price is: $ 10.
- Add to cart
-
- Sale!
Moving Average Chart
- Original price was: $ 15.$ 10Current price is: $ 10.
- Add to cart
-
- Sale!
Hexbin
- Original price was: $ 15.$ 10Current price is: $ 10.
- Add to cart
Reviews
There are no reviews yet.