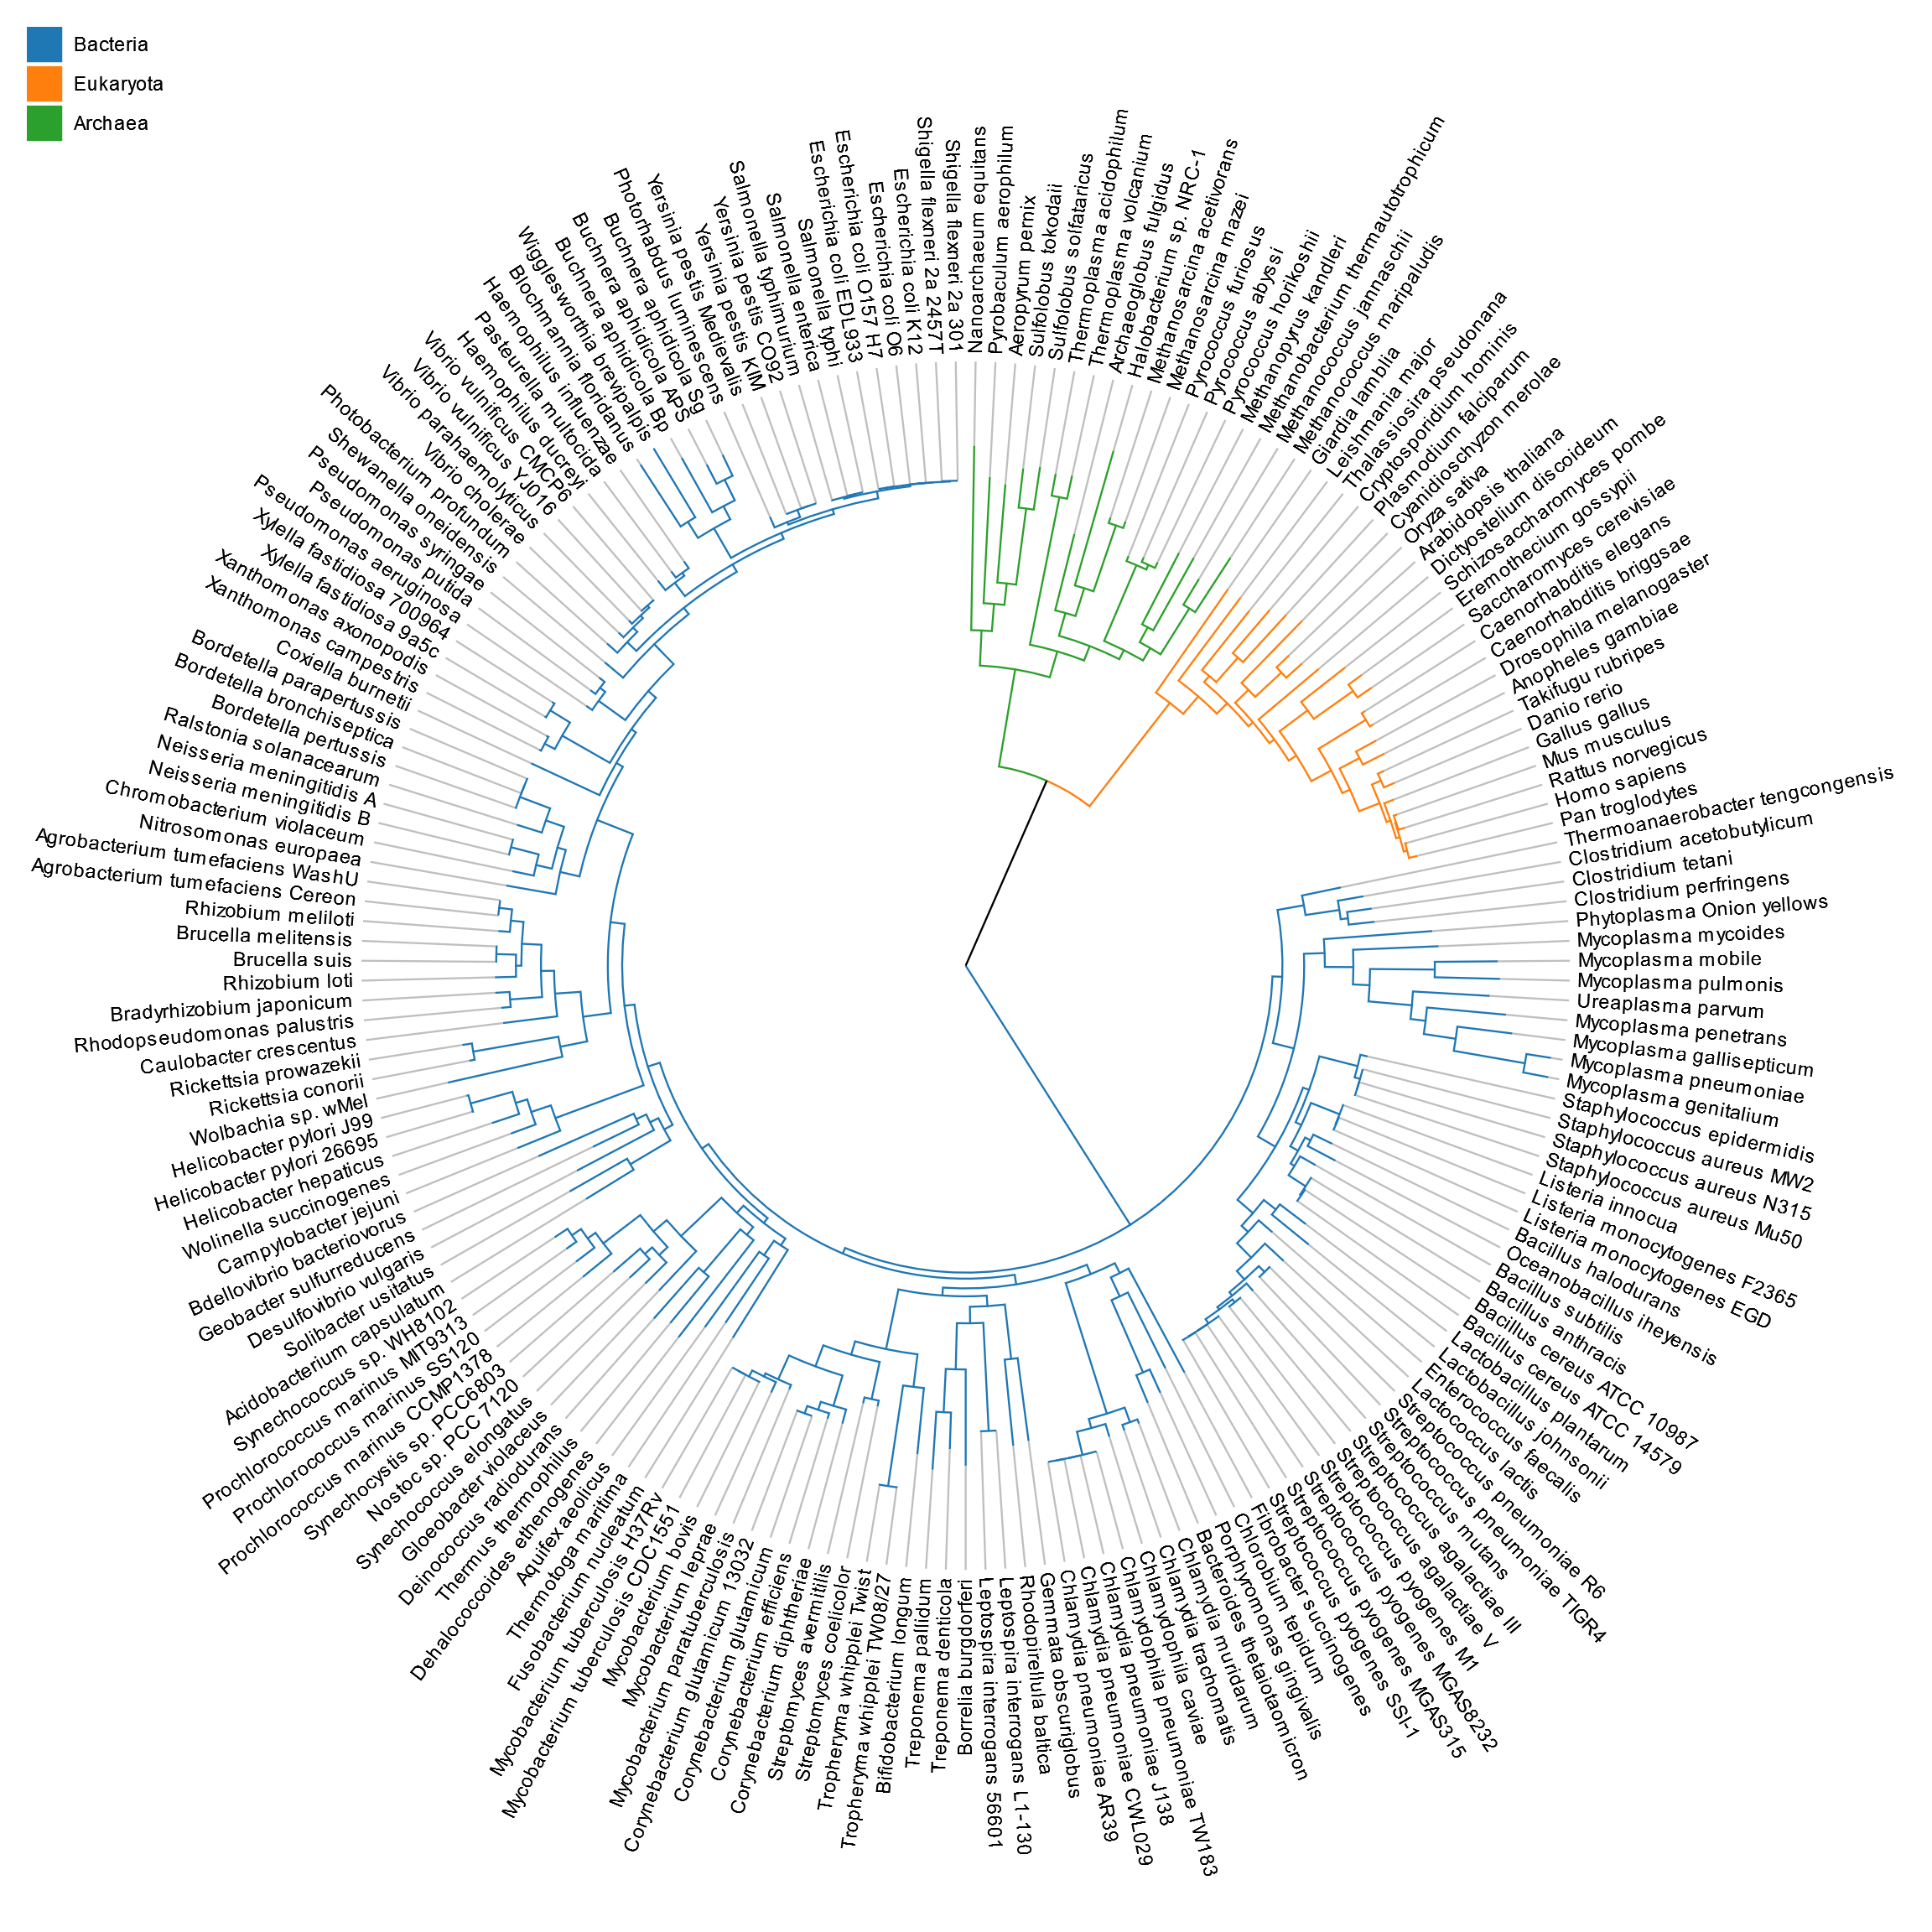
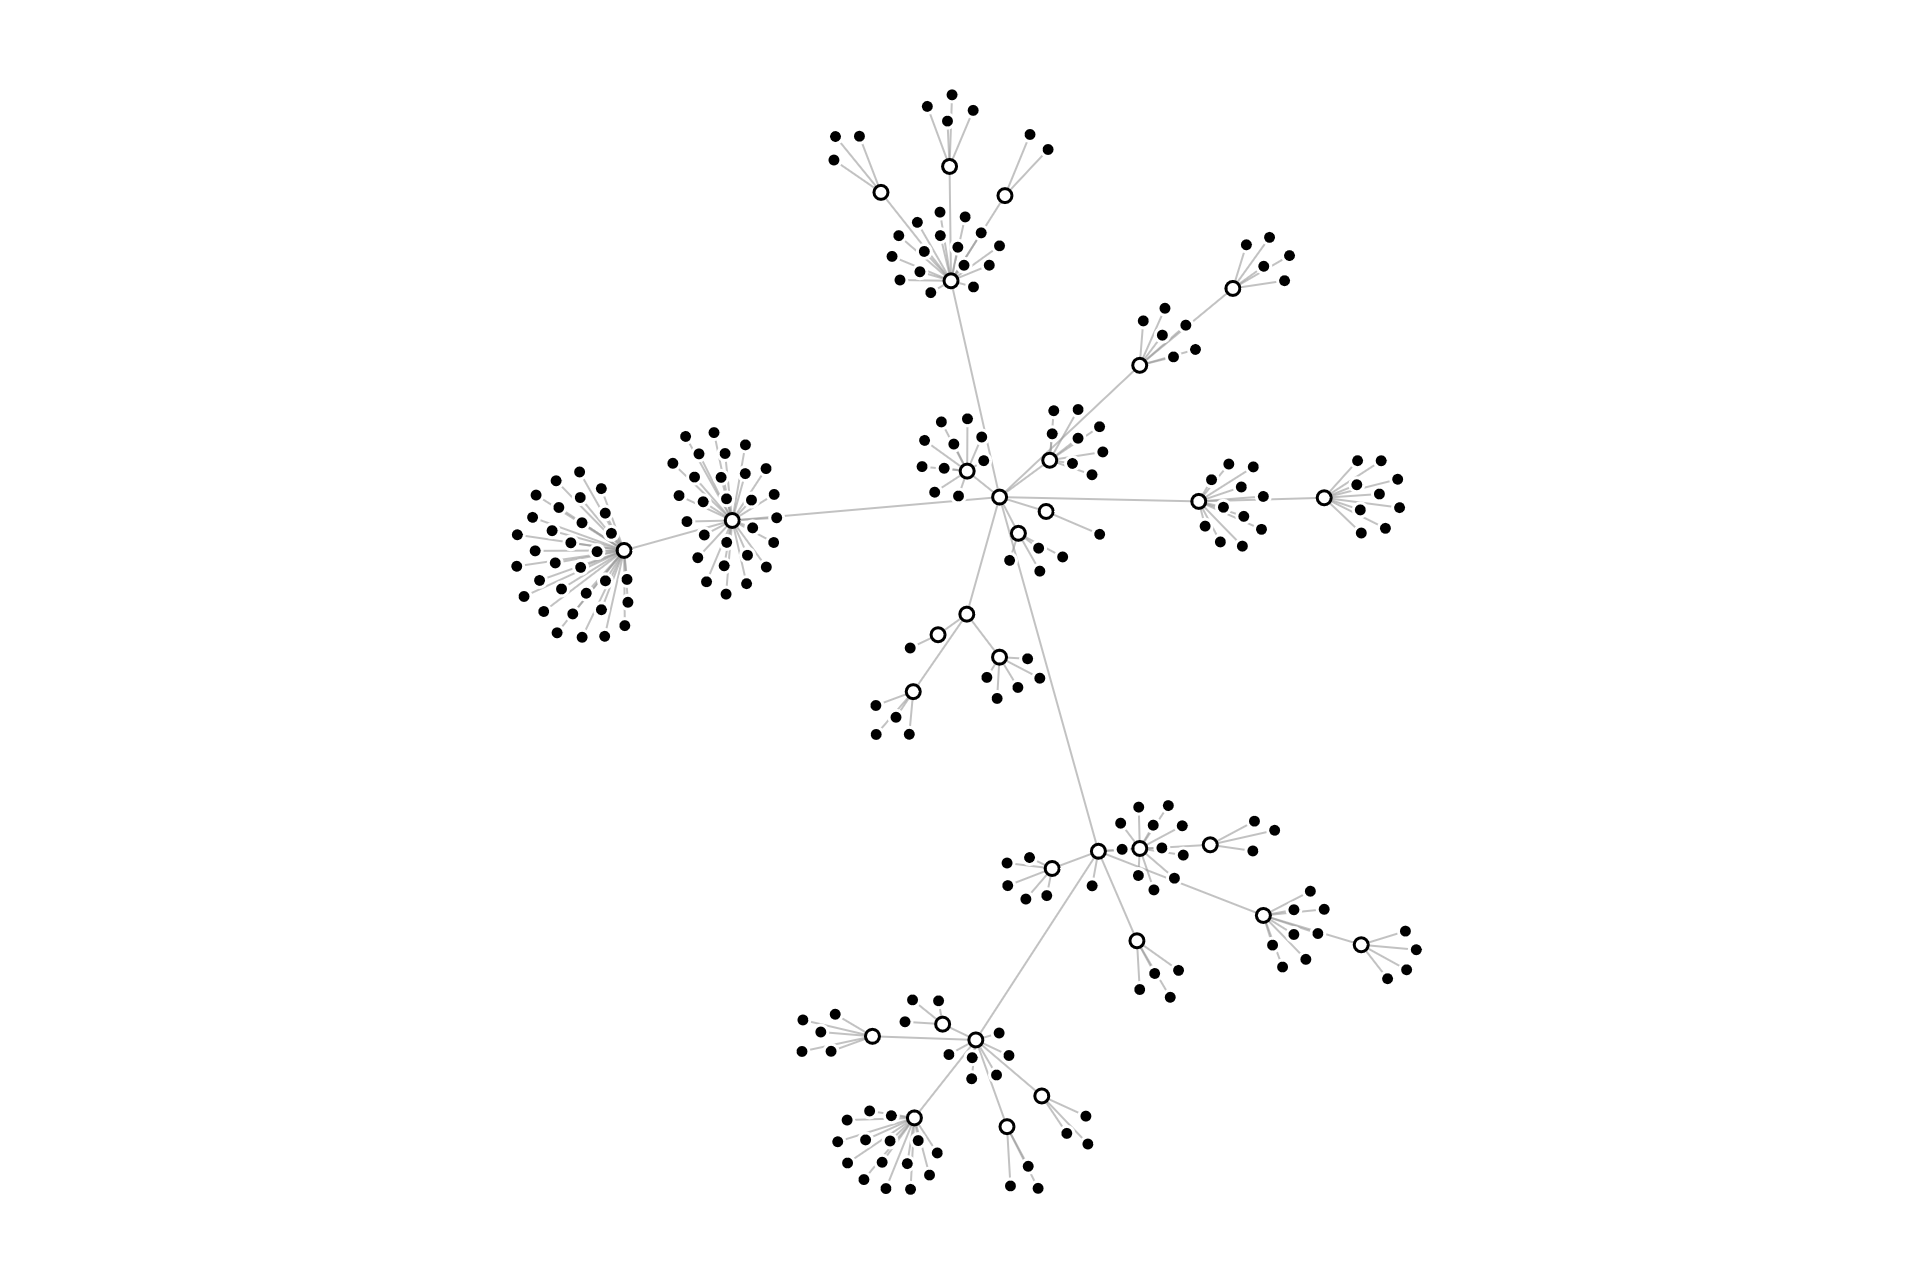
Description
A Force-Directed Tree is a dynamic and visually captivating method of representing hierarchical data structures. Unlike traditional tree diagrams with fixed node positions, force-directed trees use physics-inspired algorithms to simulate a system of attractive and repulsive forces between nodes. This approach allows nodes to naturally arrange themselves in a visually appealing layout while minimizing overlap and edge crossings. Nodes are connected by edges representing hierarchical relationships, and the placement of nodes is determined iteratively based on the balance of forces acting upon them. This results in a flexible and organic layout where nodes gravitate towards equilibrium positions, reflecting the underlying hierarchical structure of the data in an aesthetically pleasing and informative manner.
Uses:
- Data Exploration: Providing an intuitive and interactive visualization tool for exploring and navigating complex hierarchical datasets.
- Concept Mapping: Facilitating the visualization of conceptual relationships, hierarchies, and taxonomies in fields such as ontology development and knowledge representation.
- Project Management: Visualizing project structures, dependencies, and workflows to aid in project planning, scheduling, and resource allocation.
- Software Engineering: Representing software codebases, dependencies, and module hierarchies to aid in software architecture design and code refactoring.
- Social Network Analysis: Visualizing social networks, communities, and interactions to analyze network structures, centrality measures, and community detection.
- Mind Mapping: Creating interactive mind maps for brainstorming, idea generation, and organizing thoughts in creative and collaborative settings.
- Organizational Charts: Representing organizational structures, reporting relationships, and team hierarchies for HR management and organizational planning.
- Genealogy Mapping: Visualizing family trees, genealogical relationships, and ancestry data to explore family history and genetic inheritance patterns.
- Biological Networks: Analyzing biological networks, such as protein-protein interactions, metabolic pathways, and gene regulatory networks, in bioinformatics research.
- Market Basket Analysis: Exploring associations and relationships between products in transactional data for market basket analysis and recommendation systems.
Purposes:
- Visual Clarity: Providing a clear and intuitive visualization of hierarchical structures, relationships, and patterns in complex datasets.
- Interactive Exploration: Enabling users to interactively explore and manipulate the visualization to gain insights and discover hidden patterns.
- Data Analysis: Facilitating data analysis tasks such as clustering, outlier detection, and trend identification by visually examining the arrangement of nodes and edges.
- Collaborative Decision-Making: Supporting collaborative decision-making processes by visualizing decision trees, alternatives, and trade-offs in group settings.
- Presentation Aid: Serving as an effective presentation aid for communicating complex information and insights to stakeholders, clients, or colleagues.
- Problem Solving: Facilitating problem-solving activities by visually organizing and structuring information to identify solutions and formulate action plans.
- Pattern Recognition: Helping users identify patterns, trends, and anomalies within hierarchical datasets through visual pattern recognition and analysis.
- Data Mining: Supporting data mining tasks such as clustering, classification, and association rule mining by visually exploring the structure of the data.
- Visualization Customization: Allowing users to customize the visualization appearance, layout, and styling to suit their preferences and specific visualization needs.
- Educational Tool: Serving as an educational tool for teaching concepts such as graph theory, network analysis, and hierarchical data visualization in academic and professional settings.
Only logged in customers who have purchased this product may leave a review.
Related products
-
- Sale!
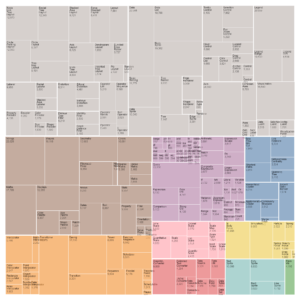
Nested Tree Map
- Original price was: $ 15.$ 10Current price is: $ 10.
- Add to cart
-
- Sale!
Tree Map
- Original price was: $ 15.$ 10Current price is: $ 10.
- Add to cart
-
- Sale!
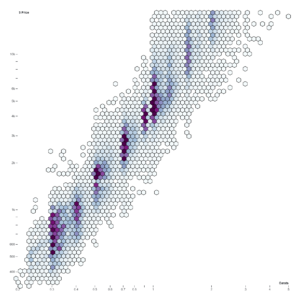
Hexbin
- Original price was: $ 15.$ 10Current price is: $ 10.
- Add to cart
Reviews
There are no reviews yet.