Sale!
Description
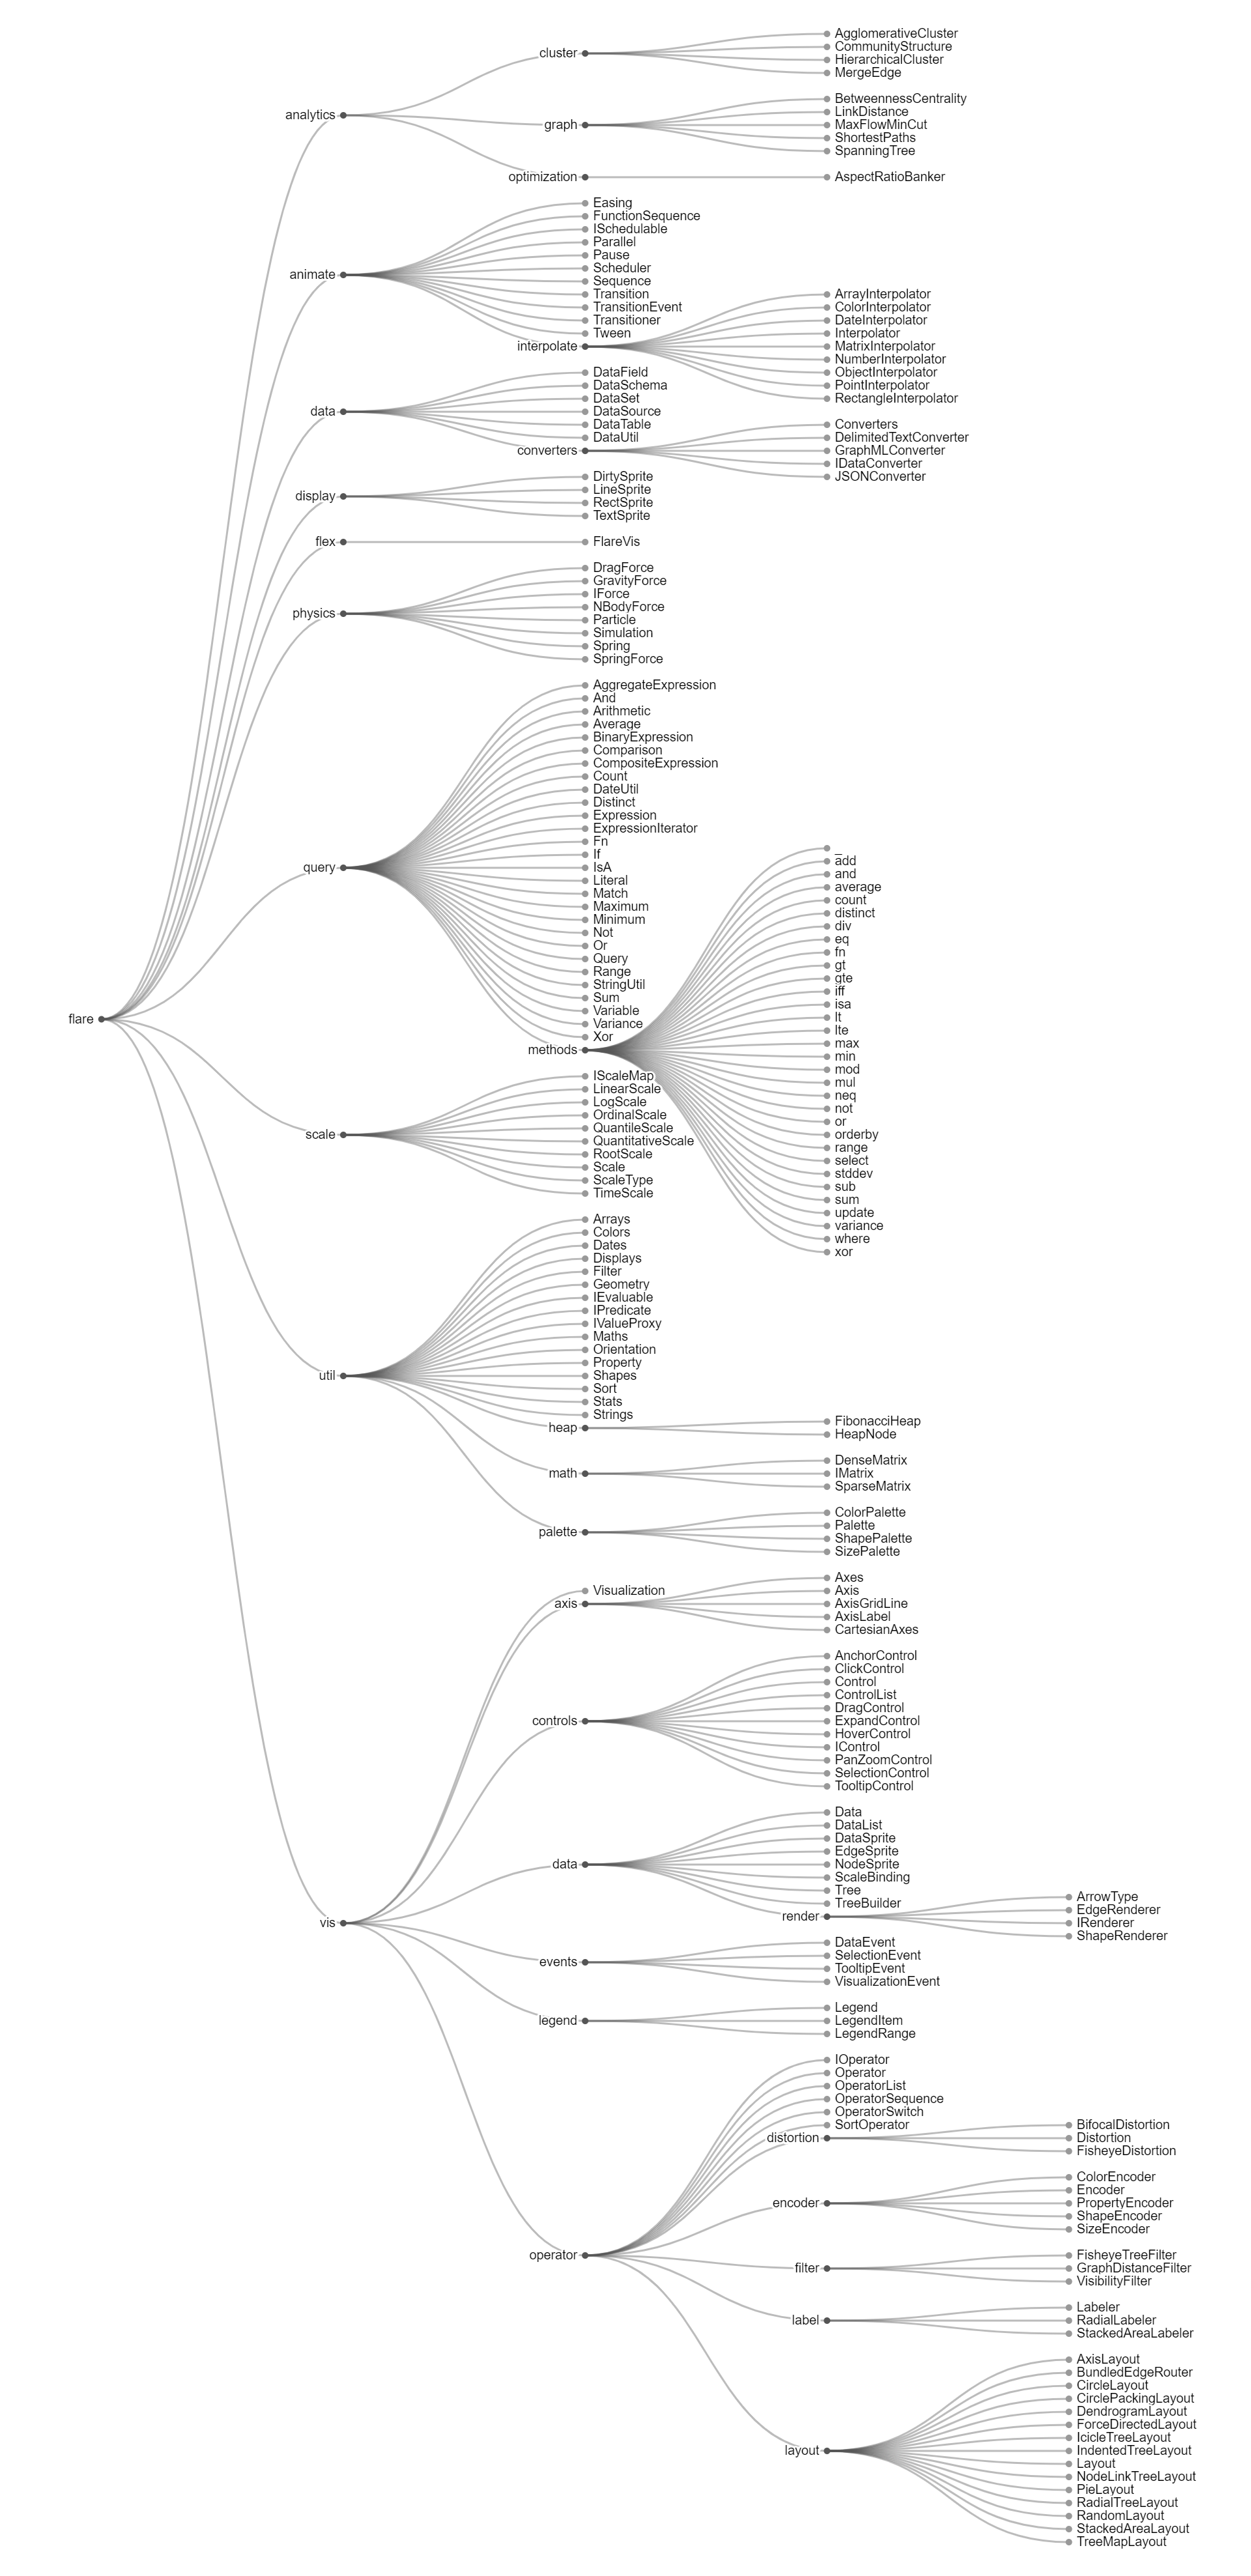
An Indented Tree chart, also known as a hierarchical or nested list, is a data visualization tool used to represent hierarchical relationships between data points or entities. In this chart, each data point is represented as a node, and the hierarchy is depicted by indenting subordinate nodes under their parent nodes. The chart typically starts with the root node at the top, followed by its immediate child nodes indented below it. Subsequent levels of the hierarchy are represented by further indentation of child nodes under their respective parent nodes. This hierarchical structure creates a visual representation of the relationships between different levels of data in a nested format. Indented Tree charts are commonly used for displaying organizational structures, file directory trees, taxonomies, family trees, or any other hierarchical data relationships. They provide a simple and intuitive way to visualize hierarchical data, allowing users to quickly understand the structure and relationships within the dataset. Additionally, Indented Tree charts can be interactive, allowing users to expand or collapse nodes to explore different levels of the hierarchy or to focus on specific branches of the tree. Overall, Indented Tree charts are valuable tools for visualizing and analyzing hierarchical data structures in a clear and organized manner.
Uses:
Uses:
- Organizational Structures: Visualizing hierarchical relationships within organizations, including departments, teams, and reporting structures.
- File Directory Trees: Displaying the hierarchical structure of file systems, including directories, subdirectories, and files.
- Taxonomies: Representing hierarchical classifications of data, such as species taxonomy, product categories, or classification schemes.
- Family Trees: Visualizing genealogical relationships between individuals, including ancestors, descendants, and extended family members.
- Project Hierarchies: Displaying the breakdown of project tasks, subtasks, and dependencies in project management.
- Document Outlines: Organizing the structure of documents, articles, or reports into hierarchical sections, sub-sections, and paragraphs.
- Website Navigation: Showing the hierarchical structure of website content, including pages, subpages, and navigation menus.
- Process Flow Diagrams: Illustrating hierarchical process flows, workflows, or decision trees in process mapping and analysis.
- Product Hierarchies: Visualizing the hierarchical structure of products, categories, and subcategories in e-commerce or product management.
- Hierarchical Data Exploration: Providing an intuitive interface for exploring and understanding the hierarchical relationships within complex datasets.
Purposes:
- Hierarchy Visualization: Displaying hierarchical relationships and structures within data in a clear and organized manner.
- Data Analysis: Facilitating the analysis of hierarchical data by visually representing the structure and relationships between data points.
- Navigation: Providing an intuitive navigation interface for exploring different levels of hierarchy within datasets or systems.
- Organization: Organizing and structuring information hierarchically to improve understanding and accessibility.
- Communication: Communicating complex hierarchical relationships and structures to stakeholders, clients, or team members.
- Decision Support: Supporting decision-making processes by providing insights into the hierarchical organization of data or systems.
- Documentation: Documenting and representing the structure of systems, processes, or datasets for reference and documentation purposes.
- Classification: Classifying and categorizing data points into hierarchical groups or categories for analysis and organization.
- Collaboration: Facilitating collaboration and teamwork by providing a shared understanding of hierarchical structures and relationships within datasets or projects.
- Knowledge Discovery: Facilitating knowledge discovery by revealing insights, patterns, or anomalies within complex hierarchical datasets through visual exploration and analysis.
Only logged in customers who have purchased this product may leave a review.
Related products
-
- Sale!
Parallel Sets
-
$ 15Original price was: $ 15.$ 10Current price is: $ 10. - Add to cart
-
- Sale!
Moving Average Chart
-
$ 15Original price was: $ 15.$ 10Current price is: $ 10. - Add to cart
-
- Sale!
Q-Q Plot
-
$ 15Original price was: $ 15.$ 10Current price is: $ 10. - Add to cart


Reviews
There are no reviews yet.