Description
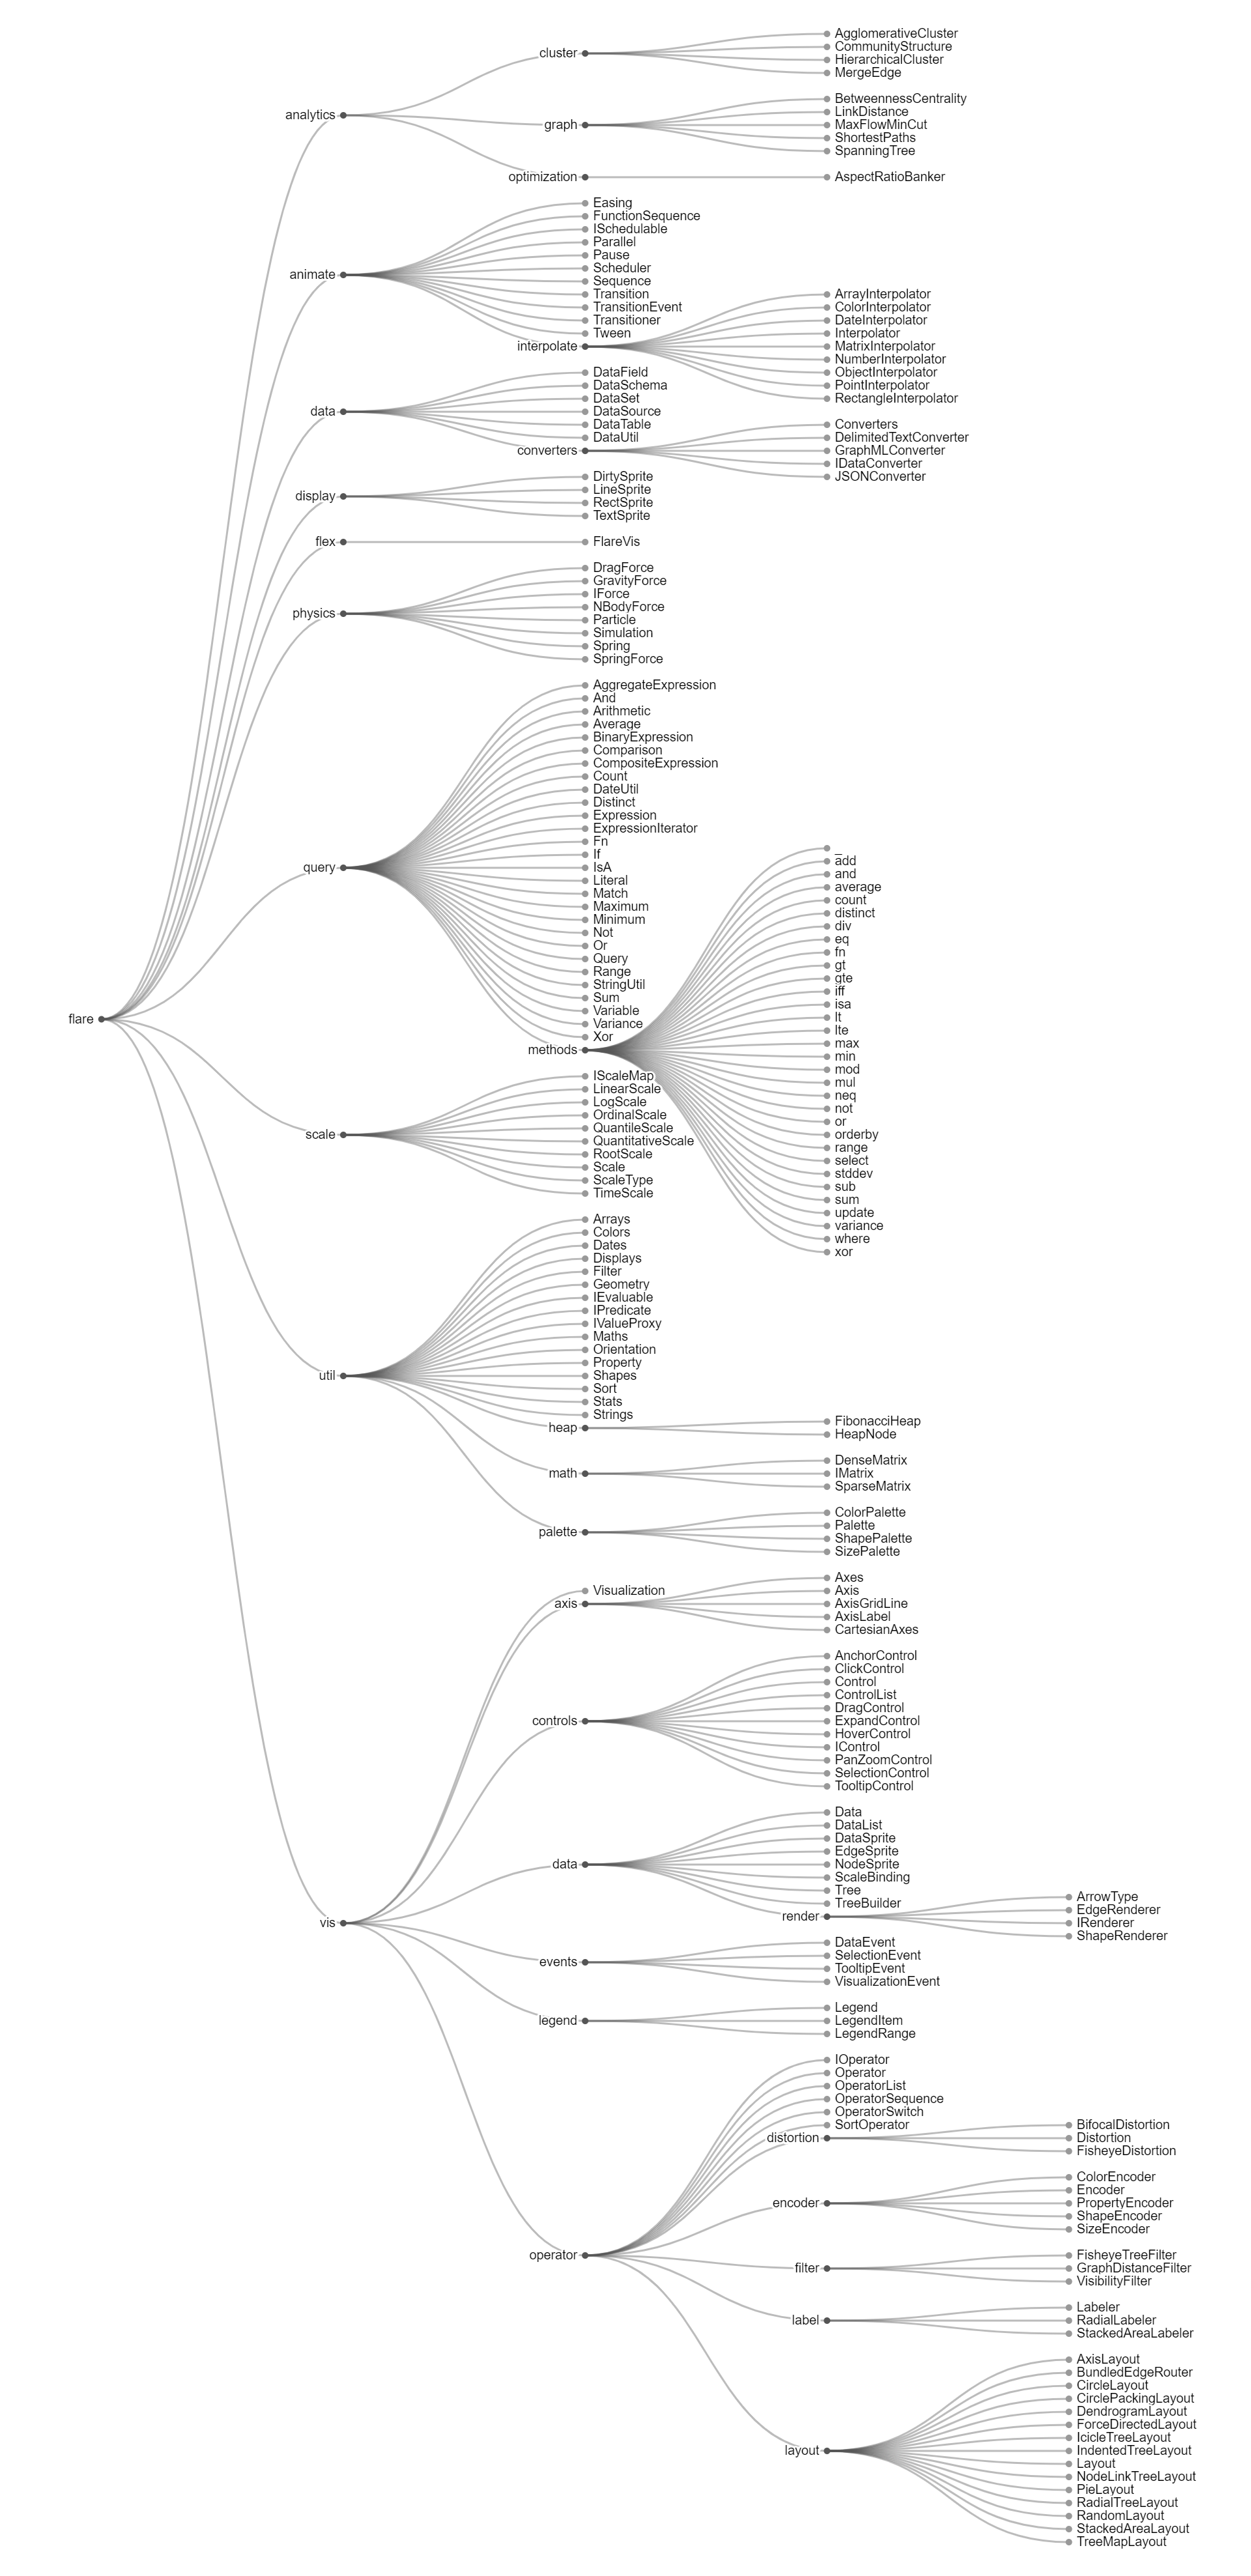
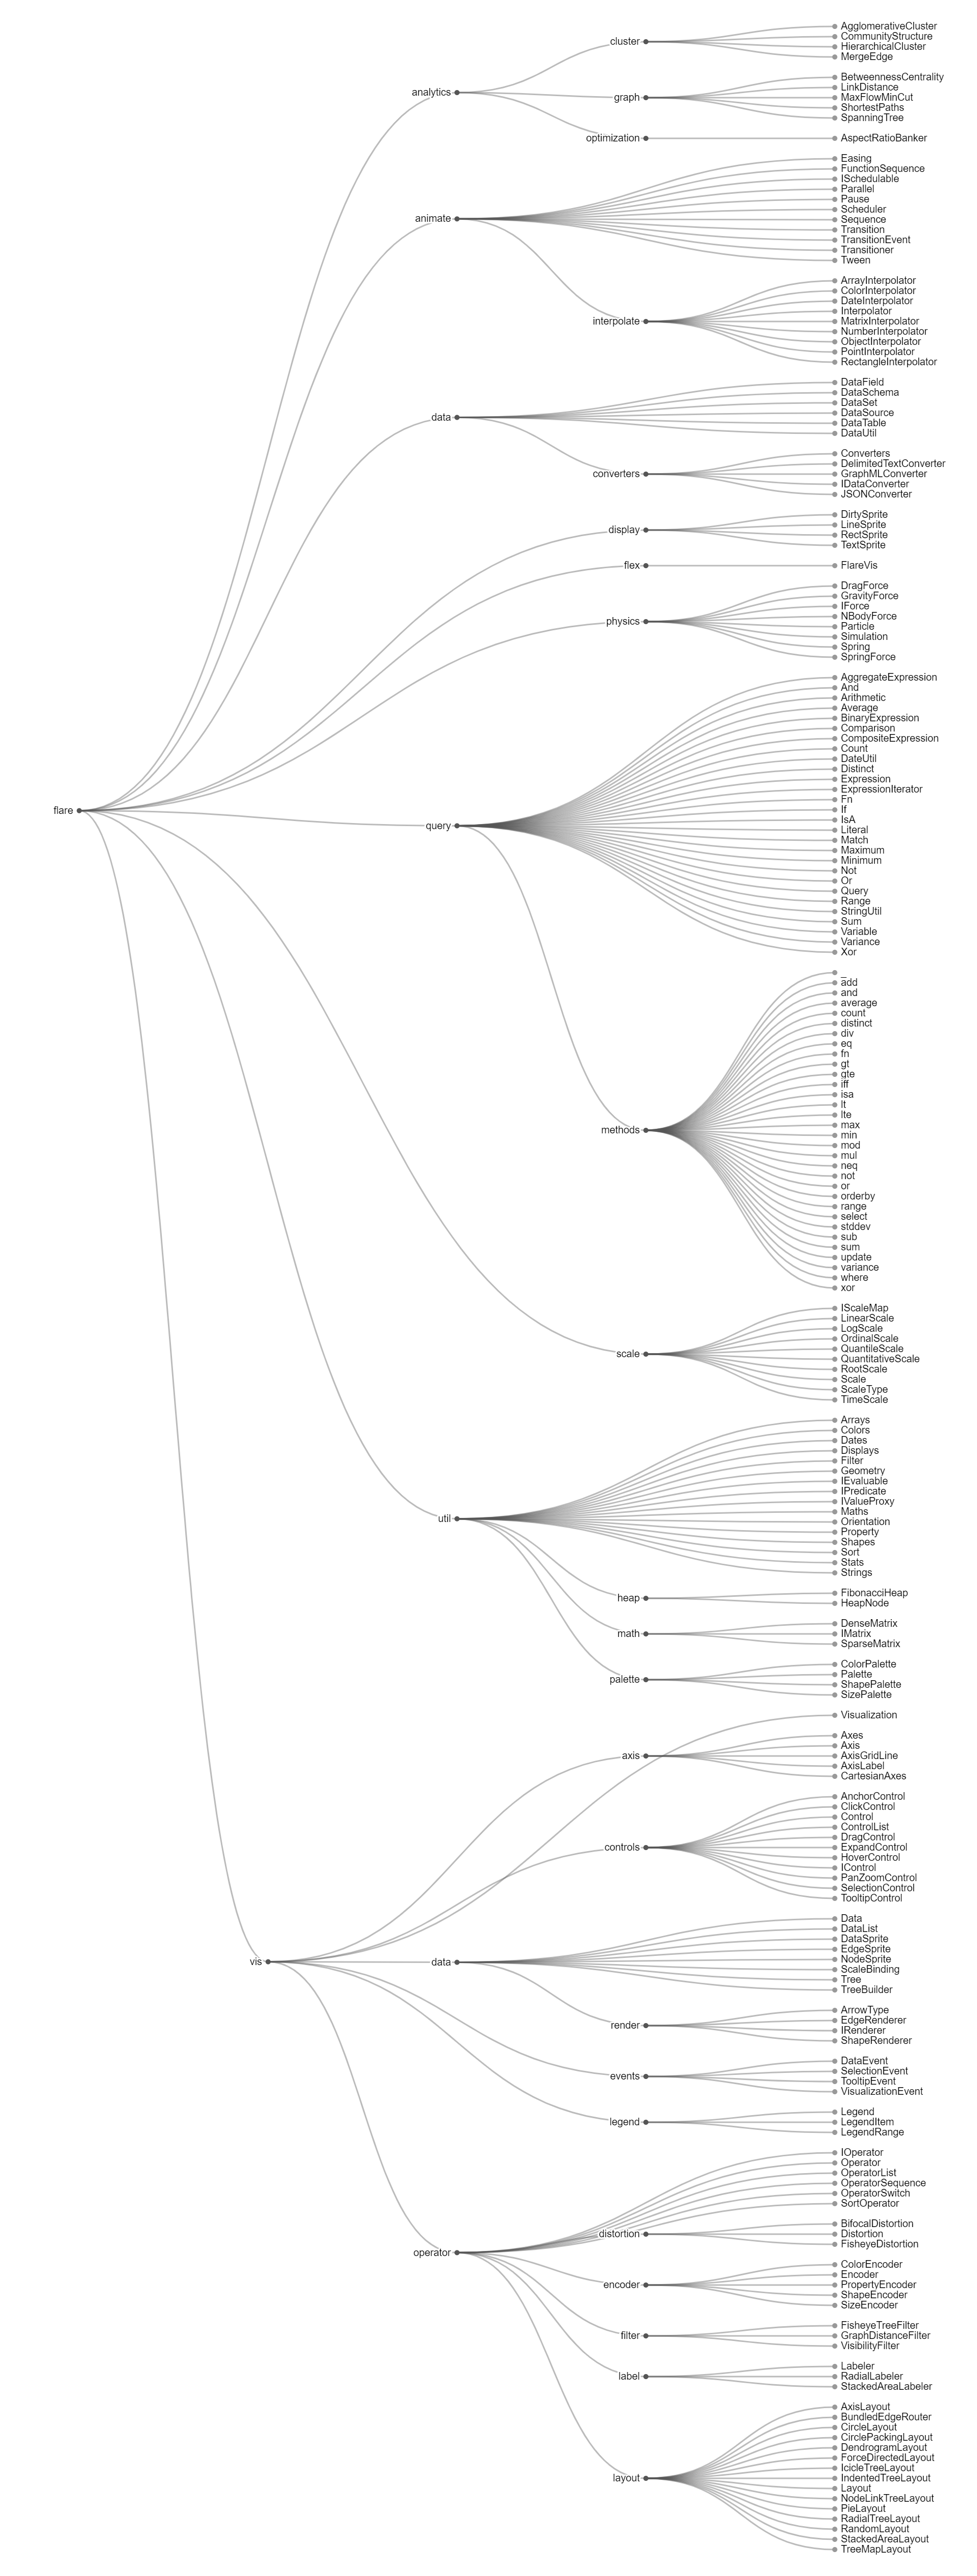
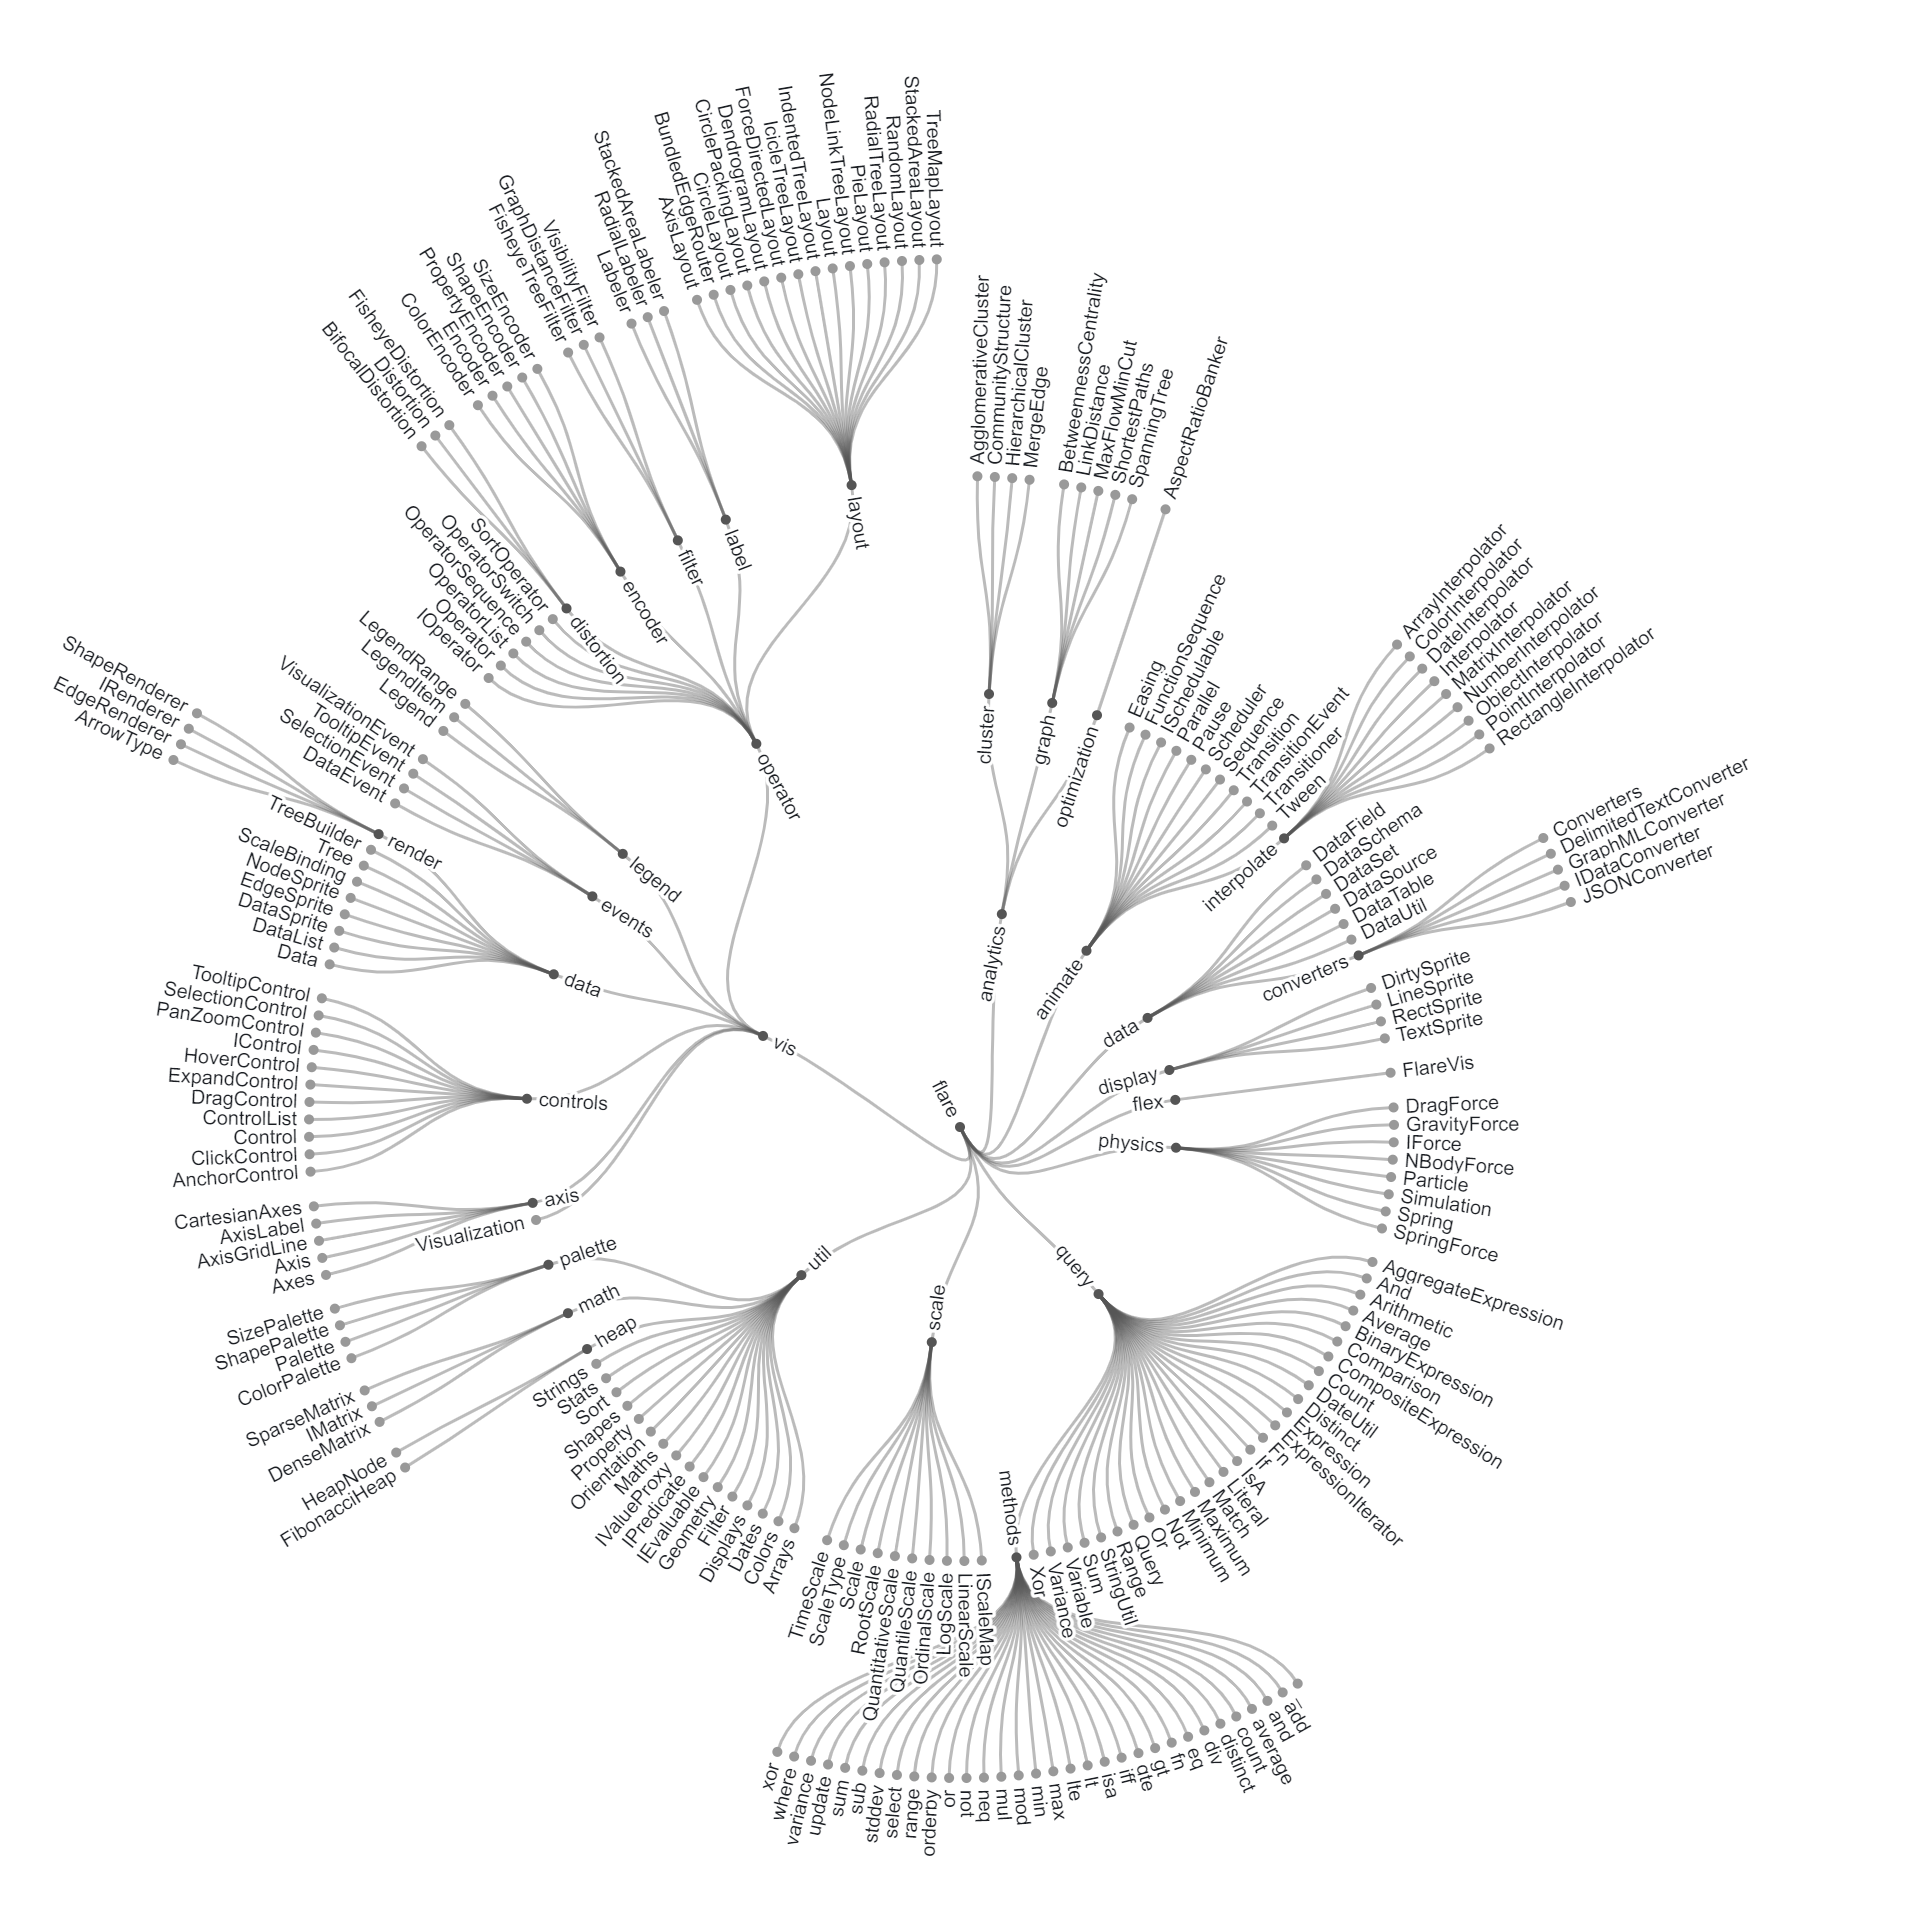
The Radial Tidy Tree chart is a type of hierarchical data visualization that presents hierarchical relationships in a radial layout, where nodes are arranged in concentric circles or rings around a central point. Each node represents a data point or entity, and the hierarchical relationships between nodes are depicted by connecting lines or curves that radiate outward from the central point. The Radial Tidy Tree chart follows the principles of the tidy tree layout algorithm, which arranges nodes in a structured and organized manner to minimize visual clutter and improve readability. Nodes are positioned along circular arcs within each ring, with parent nodes located closer to the central point and child nodes placed further away, creating a visually appealing and intuitive representation of hierarchical data. The chart’s radial layout allows for the visualization of hierarchical structures with multiple levels of nesting, making it suitable for a wide range of applications, including organizational charts, genealogical trees, hierarchical classifications, and network diagrams. The Radial Tidy Tree chart provides users with a clear and concise overview of hierarchical relationships within a dataset, enabling them to explore and analyze complex data structures in a visually intuitive manner. Additionally, it can be interactive, allowing users to interact with individual nodes, zoom in on specific branches, and collapse or expand levels of the hierarchy for detailed exploration. Overall, the Radial Tidy Tree chart is a powerful tool for visualizing hierarchical data and gaining insights into the relationships and structures within the dataset.
Uses:
- Organizational Structures: Visualizing hierarchical relationships within organizations, including departments, teams, and reporting structures.
- Genealogical Trees: Representing family trees and ancestral relationships, providing a comprehensive overview of familial connections and lineages.
- Hierarchical Classifications: Visualizing hierarchical classifications of data, such as species taxonomy, product categories, or organizational hierarchies.
- Network Analysis: Mapping network structures and relationships, including social networks, communication patterns, and organizational networks.
- Process Flow Diagrams: Illustrating hierarchical process flows, workflows, or decision trees in process mapping and analysis.
- Product Hierarchies: Mapping product hierarchies and classifications in e-commerce platforms, helping users navigate product categories, attributes, and variations.
- Historical Timelines: Representing historical events and their chronological relationships, offering a comprehensive overview of historical timelines and epochs.
- Geographical Mapping: Mapping geographical data, such as geographic regions, terrain features, or climate zones, in a radial layout for spatial analysis and visualization.
- Conceptual Mapping: Mapping complex ideas, concepts, and relationships in a radial layout, fostering creative thinking, problem-solving, and knowledge discovery.
- Educational Tools: Creating interactive educational tools and visual aids for teaching subjects such as history, biology, geography, or organizational behavior, providing students with engaging and informative learning experiences.
Purposes:
- Holistic Visualization: Providing a holistic and comprehensive visualization of hierarchical data, allowing users to see the entire dataset at a glance.
- Spatial Representation: Representing spatial relationships and distributions in a circular format, offering a unique perspective on geographical, biological, or network data.
- Conceptual Mapping: Mapping complex ideas, concepts, and relationships in a radial layout, fostering creative thinking, problem-solving, and knowledge discovery.
- Interactive Exploration: Enabling interactive exploration and navigation of hierarchical datasets, allowing users to zoom in, zoom out, and interact with individual nodes and clusters.
- Pattern Identification: Facilitating the identification of patterns, clusters, and trends within hierarchical datasets, aiding in data analysis and insight generation.
- Comparative Analysis: Supporting comparative analysis of different hierarchical structures or datasets, allowing users to compare patterns, distributions, and relationships.
- Communication Aid: Serving as a visual communication aid for presenting complex hierarchical data to stakeholders, clients, or colleagues, enhancing understanding and decision-making.
- Storytelling Tool: Using radial layouts to create engaging and interactive storytelling experiences, presenting narratives, timelines, and historical events in a visually compelling format.
- Dynamic Visualization: Creating dynamic and interactive visualizations that respond to user inputs and interactions, providing a customizable and engaging user experience.
- Creative Expression: Allowing for creative expression and artistic visualization of hierarchical data, combining aesthetics with functionality to create visually appealing and informative charts.
Only logged in customers who have purchased this product may leave a review.
Related products
-
- Sale!
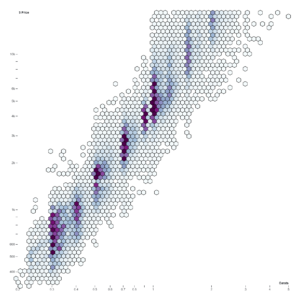
Hexbin
- Original price was: $ 15.$ 10Current price is: $ 10.
- Add to cart
-
- Sale!
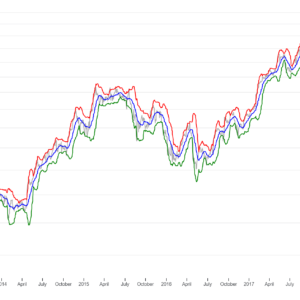
Bollinger bands
- Original price was: $ 15.$ 10Current price is: $ 10.
- Add to cart
-
- Sale!
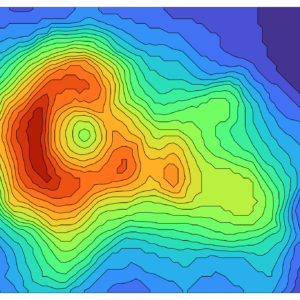
Volcano Contours
- Original price was: $ 15.$ 10Current price is: $ 10.
- Add to cart
Reviews
There are no reviews yet.