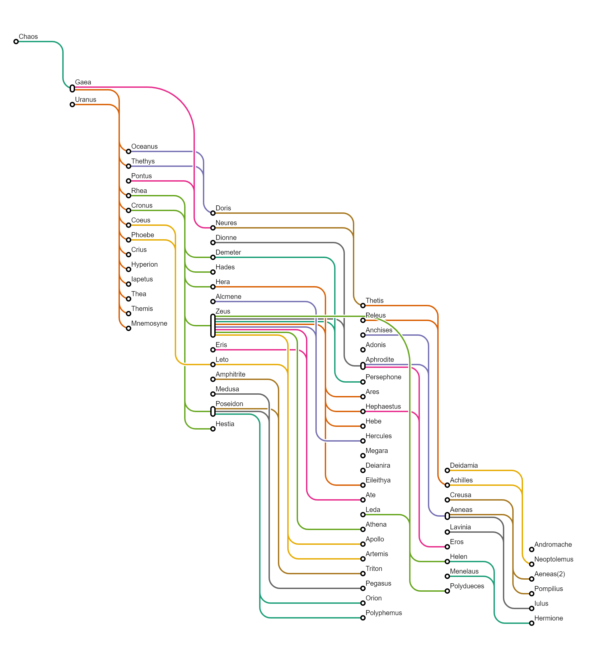
Tangled Tree Visualization charts are a unique and innovative approach to visualizing hierarchical data that diverges from traditional hierarchical tree structures. In Tangled Tree Visualization, hierarchical relationships are represented through a network of interconnected nodes, resembling a tangle of branches in a tree. Unlike conventional tree structures, where nodes are arranged hierarchically in a top-down or left-to-right manner, Tangled Tree Visualization charts allow nodes to be connected in multiple directions, resulting in a more complex and interconnected representation of the data. Tangled Tree Visualization charts offer a dynamic and intricate representation of hierarchical data, resembling a network of interconnected branches in a tree. Nodes are interconnected in multiple directions, creating a complex web-like structure that reflects the intricate relationships within the dataset. This non-linear arrangement allows for a more flexible and intuitive exploration of hierarchical relationships, enabling users to uncover hidden patterns and connections that may not be apparent in traditional tree structures.
Uses:
- Network Analysis: Visualizing complex networks and relationships within datasets, such as social networks, communication networks, or biological networks.
- Data Integration: Integrating and visualizing data from multiple sources or domains to uncover relationships and connections between disparate datasets.
- Dependency Analysis: Analyzing dependencies and relationships between components or entities within a system or process.
- Knowledge Graphs: Representing knowledge graphs and ontologies to visualize semantic relationships between concepts, entities, and attributes.
- Workflow Visualization: Visualizing workflow processes, task dependencies, and project timelines in project management and process optimization.
- Concept Mapping: Mapping complex ideas, concepts, and relationships to foster creative thinking, brainstorming, and problem-solving activities.
- Event Sequencing: Representing temporal sequences of events and their interconnections in event-driven processes or systems.
- Spatial Analysis: Analyzing spatial relationships and distributions within geographic datasets, such as land use patterns or ecological networks.
- Resource Allocation: Visualizing resource allocations and distributions across different projects, departments, or initiatives within an organization.
- Causal Inference: Exploring causal relationships and pathways between variables in causal inference analysis and modeling.
Purposes:
- Pattern Identification: Facilitating the identification of complex patterns, clusters, and trends within hierarchical datasets.
- Dynamic Exploration: Enabling interactive exploration and navigation of hierarchical relationships through a flexible and intuitive interface.
- Non-linear Representation: Offering a non-linear representation of hierarchical data that allows for more nuanced and interconnected visualizations.
- Comparative Analysis: Supporting comparative analysis of different hierarchical structures or datasets to uncover similarities, differences, and relationships.
- Complex Systems Analysis: Analyzing complex systems and phenomena by visualizing the interconnections and dependencies between system components.
- Information Retrieval: Retrieving and exploring hierarchical information within large datasets to gain insights and make informed decisions.
- Storytelling Tool: Using dynamic and interactive visualizations to tell engaging stories and narratives that highlight the connections and relationships within the data.
- Collaborative Analysis: Facilitating collaborative analysis and decision-making by providing a shared visualization platform for exploring hierarchical relationships.
- Data Exploration: Supporting exploratory data analysis by enabling users to interactively explore and manipulate hierarchical datasets to uncover insights.
- Visual Communication: Serving as a visual communication tool for presenting complex hierarchical data to stakeholders, clients, or colleagues in a clear and compelling manner.

Reviews
There are no reviews yet.