Description
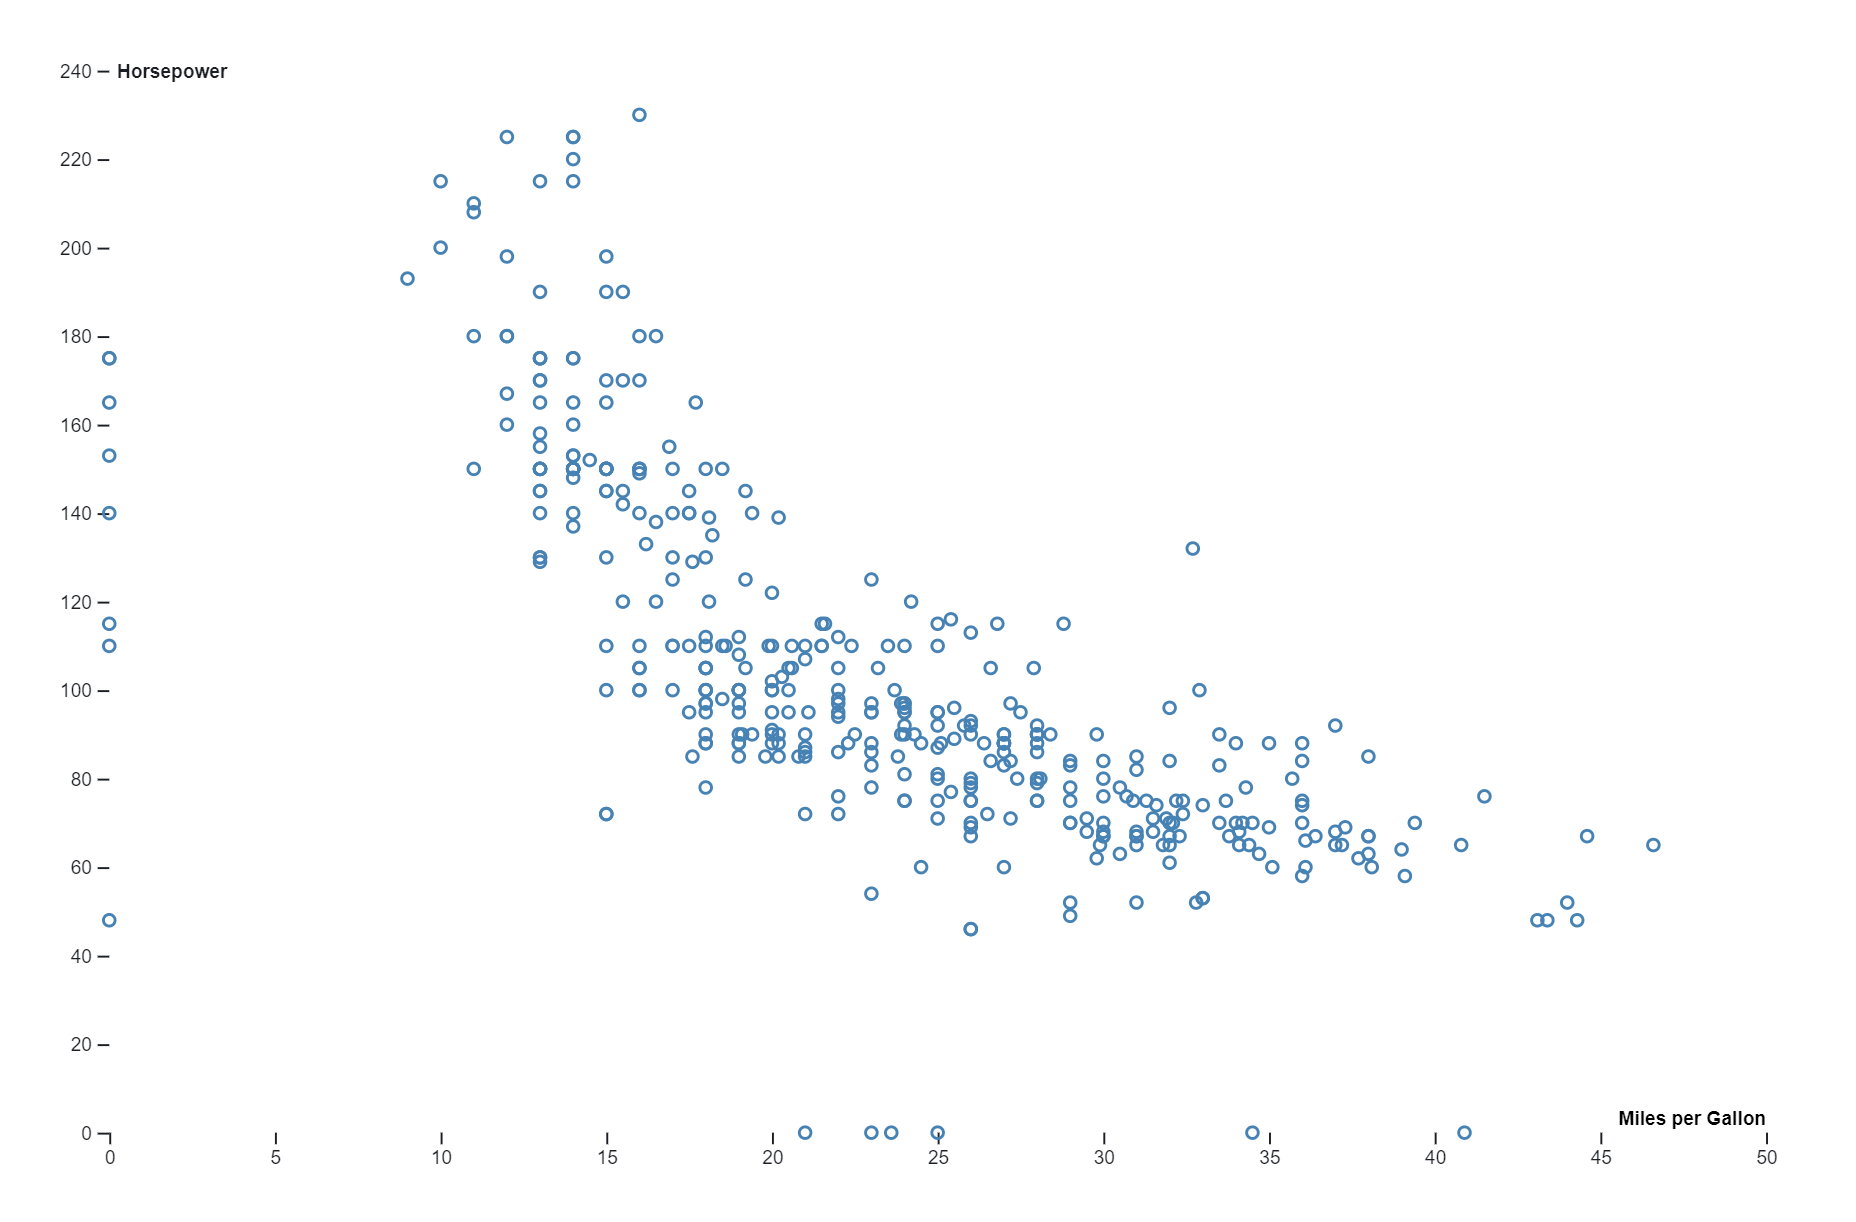
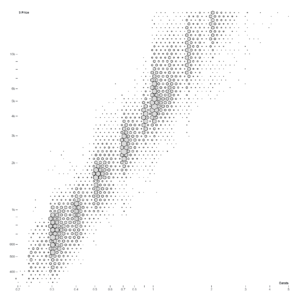
A brushable scatterplot is a dynamic visualization tool that allows users to interactively select and highlight subsets of data points within the plot by “brushing” over them with a cursor or touch input. This technique enables users to explore relationships between variables in real-time and identify patterns or trends within specific regions of interest. Brushable scatterplots are commonly used in exploratory data analysis and interactive data visualization applications, offering an intuitive way to filter and analyze large datasets while maintaining context and preserving the overall visual representation of the data.
- Interactive Data Exploration: Brushable scatterplots allow users to interactively explore relationships between variables by selecting and highlighting specific subsets of data points. This enables users to identify patterns, trends, and outliers within the data more effectively.
- Filtering Data: Users can use the brush tool to filter the dataset and focus on specific regions of interest. This helps in isolating relevant data points and reducing visual clutter, especially in large datasets.
- Comparing Subsets: The brushable feature allows for the comparison of multiple subsets of data within the same plot. Users can brush over different areas of the scatterplot to compare the relationships between variables across different groups or categories.
- Identifying Correlations: Brushable scatterplots facilitate the identification of correlations between variables by allowing users to visually inspect the relationships between selected data points in real-time.
- Supporting Hypothesis Testing: Researchers can use brushable scatterplots to test hypotheses and explore potential relationships between variables by interactively selecting and analyzing different subsets of data.
- Interactive Data Visualization: Brushable scatterplots enhance the interactivity of data visualization applications, providing users with a more engaging and intuitive way to explore and analyze datasets.
- Exploratory Data Analysis: Brushable scatterplots are valuable tools for exploratory data analysis, enabling users to dynamically explore and visualize complex datasets and gain insights into the underlying patterns and structures of the data.
- Facilitating Communication: Brushable scatterplots can be used to communicate insights and findings from data analysis to stakeholders or audiences in a clear, concise, and visually appealing manner, enhancing understanding and interpretation of the data.
- User-Centric Analysis: By allowing users to interactively select and manipulate data points, brushable scatterplots empower users to conduct more user-centric analysis tailored to their specific needs and preferences.
- Enhancing Data-Driven Decision Making: Brushable scatterplots support data-driven decision-making processes by providing users with the tools they need to explore and analyze data effectively, leading to more informed and evidence-based decisions.
A brushable scatterplot, which allows users to interactively select and highlight subsets of data points by “brushing” over them, serves several important purposes:
- Data Exploration: Users can explore relationships between variables by selecting specific subsets of data points and observing how they behave within the scatterplot.
- Pattern Identification: Brushable scatterplots enable users to identify patterns, trends, clusters, or outliers within the dataset by interactively selecting and highlighting relevant data points.
- Comparative Analysis: Users can compare different subsets of data points within the same scatterplot, facilitating comparative analysis and aiding in the understanding of differences or similarities between groups.
- Outlier Detection: By interactively selecting and highlighting subsets of data points, users can easily detect outliers or anomalies within the dataset, which may require further investigation.
- Correlation Assessment: Users can assess the strength and direction of correlations between variables by visually inspecting the relationships between selected subsets of data points.
- Data Filtering: Brushable scatterplots allow users to filter the dataset based on specific criteria or conditions, focusing the analysis on relevant subsets of data points while excluding irrelevant ones.
- Hypothesis Testing: Researchers can use brushable scatterplots to test hypotheses and explore potential relationships between variables by interactively selecting and analyzing different subsets of data.
- Interactive Data Visualization: Brushable scatterplots enhance the interactivity of data visualization applications, providing users with a more engaging and intuitive way to explore and analyze datasets.
- Facilitating Decision-Making: Brushable scatterplots support data-driven decision-making processes by providing users with the tools they need to explore and analyze data effectively, leading to more informed decisions.
- Enhancing Communication: Brushable scatterplots can be used to communicate insights and findings from data analysis to stakeholders or audiences in a clear, concise, and visually appealing manner, facilitating understanding and interpretation of the data.
Only logged in customers who have purchased this product may leave a review.
Related products
-
- Sale!
Hexbin Map
-
$ 15Original price was: $ 15.$ 10Current price is: $ 10. - Add to cart
-
- Sale!
-
$ 15Original price was: $ 15.$ 10Current price is: $ 10. - Add to cart
-
- Sale!
Clustre Dendogram
-
$ 15Original price was: $ 15.$ 10Current price is: $ 10. - Add to cart

Reviews
There are no reviews yet.