Sale!

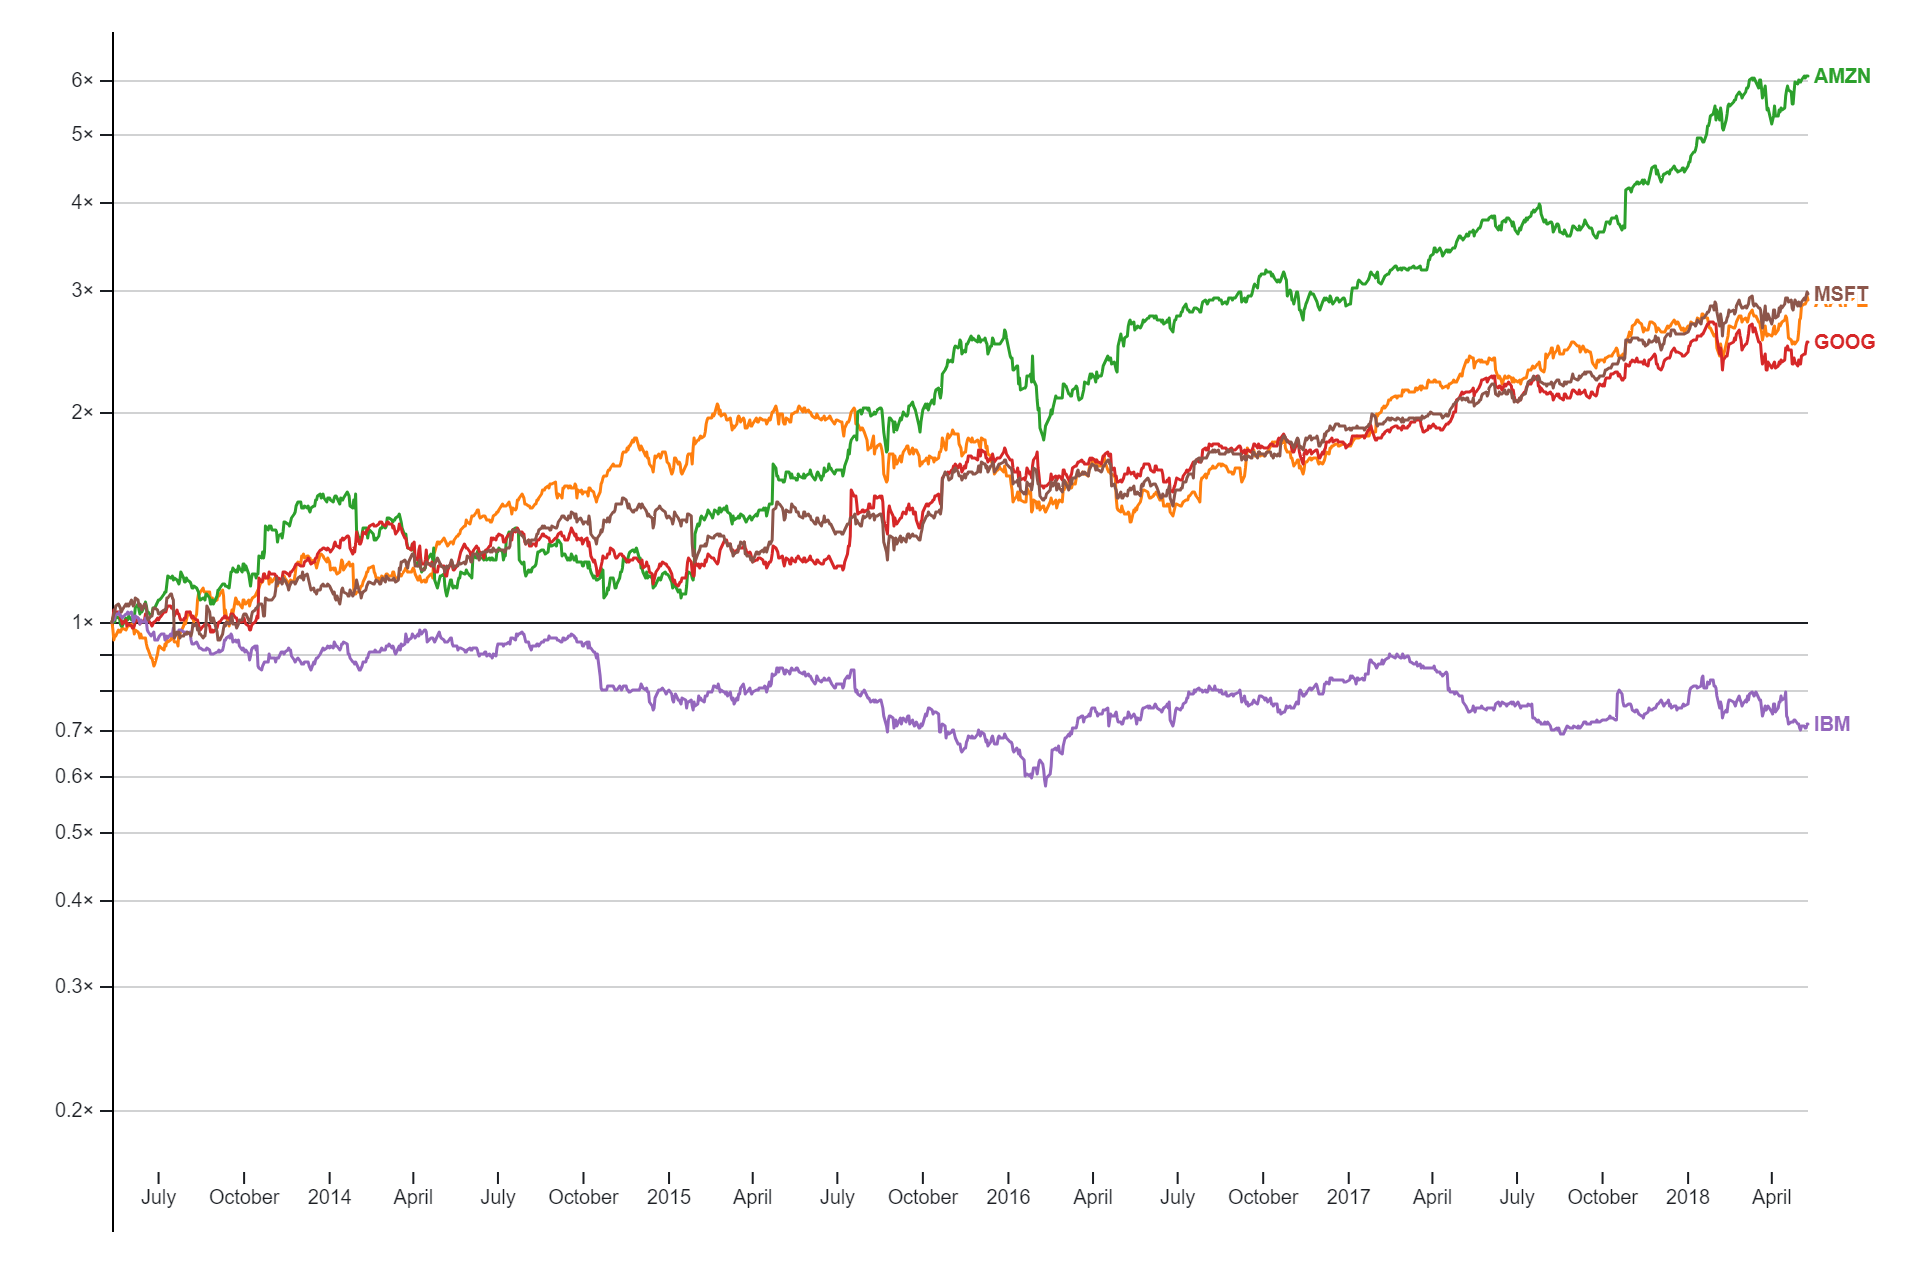
Index Chart

Original price was: $ 15.Current price is: $ 10.

Description

Description :

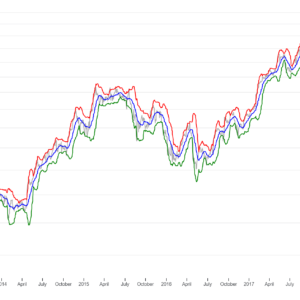
An index chart is a graphical representation that displays the performance of a specific financial market index over time. It typically consists of a line or bar graph showing the index value plotted against time, such as days, weeks, months, or years. Index charts are commonly used in finance and investment to track the overall movement and trends of a particular market index, providing insights into the performance of the underlying assets or securities comprising the index.

Purpose  :

The purpose of an index chart is to provide a visual representation of the performance of a specific financial market index over time. Key purposes include:

  1. Tracking Market Trends: Index charts allow investors to track the overall movement and trends of a market index, providing insights into whether the market is trending upward, downward, or sideways.
  2. Benchmarking Performance: Investors use index charts to compare the performance of their investment portfolios or individual securities against the performance of a market index. This helps in assessing the relative performance of investments and determining whether they are outperforming or underperforming the broader market.
  3. Monitoring Investment Decisions: Index charts serve as a tool for monitoring investment decisions and evaluating the effectiveness of investment strategies. Investors can use index charts to gauge the impact of market events, economic indicators, or geopolitical factors on their investment holdings.
  4. Asset Allocation: Index charts assist in asset allocation decisions by providing information on the performance of different asset classes represented by market indices. Investors can adjust their asset allocation strategy based on the relative performance of various market segments.
  5. Risk Management: Index charts aid in risk management by identifying periods of market volatility or downturns. Investors can use index charts to assess the level of risk in the market and adjust their investment strategies accordingly.
  6. Market Analysis: Financial professionals, analysts, and researchers use index charts for market analysis, studying historical patterns, correlations, and trends in market indices to make informed forecasts and predictions about future market movements.

Overall, the purpose of an index chart is to serve as a valuable tool for investors, financial professionals, and researchers in tracking market trends, benchmarking performance, monitoring investment decisions, guiding asset allocation, managing risk, and conducting market analysis.

Uses :

The uses of an index chart include:

  1. Tracking Market Performance: Index charts are used to monitor the performance of specific financial market indices over time, providing insights into overall market trends and movements.
  2. Benchmarking Investments: Investors use index charts to benchmark the performance of their investment portfolios or individual securities against the performance of a market index. This helps in assessing the relative performance of investments and making informed decisions.
  3. Asset Allocation: Index charts assist in asset allocation decisions by providing information on the performance of different asset classes represented by market indices. Investors can adjust their asset allocation strategy based on the relative performance of various market segments.
  4. Market Analysis: Financial professionals and analysts use index charts for market analysis, studying historical patterns, correlations, and trends in market indices to make forecasts and predictions about future market movements.
  5. Risk Management: Index charts aid in risk management by identifying periods of market volatility or downturns. Investors can use index charts to assess the level of risk in the market and adjust their investment strategies accordingly.
  6. Investment Research: Researchers and analysts use index charts to conduct investment research, studying the performance of different market sectors, industries, or geographic regions represented by market indices.
  7. Market Sentiment: Index charts can reflect market sentiment and investor confidence, providing insights into investor attitudes and expectations about future market movements.
  8. Historical Analysis: Index charts are used for historical analysis, allowing users to study past market trends and movements to identify patterns and correlations that may inform future investment decisions.

Overall, index charts serve as valuable tools for investors, financial professionals, researchers, and analysts in tracking market performance, benchmarking investments, guiding asset allocation, conducting market analysis, managing risk, and making informed investment decisions.

Reviews

There are no reviews yet.

Only logged in customers who have purchased this product may leave a review.