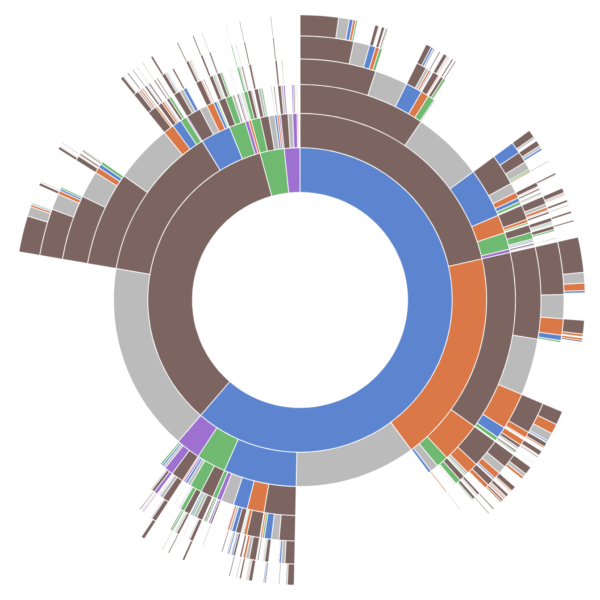
The uses of sequence sunburst visualizations include:
- Organizational Structure Visualization: Sequence sunburst visualizations can represent organizational hierarchies, such as corporate structures, team compositions, or departmental breakdowns. Users can explore the relationships between different levels of the organization and understand reporting lines, team compositions, and organizational roles.
- Website Navigation Design: Sequence sunburst visualizations can be used to design intuitive website navigation structures. By representing website content hierarchically, users can navigate through different sections, pages, and categories with ease. This is particularly useful for websites with complex content structures, such as e-commerce platforms or information-rich websites.
- Product Categorization and Analysis: In e-commerce and retail industries, sequence sunburst visualizations can help categorize products hierarchically. Users can explore product categories, subcategories, and product attributes, facilitating product analysis, merchandising, and inventory management.
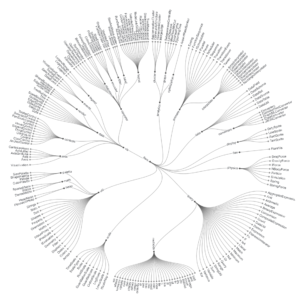
- Biological Taxonomy Visualization: Sequence sunburst visualizations are commonly used in biology to represent hierarchical taxonomic classifications of organisms. Users can explore the relationships between different taxa, such as kingdoms, phyla, classes, orders, families, genera, and species, aiding in biological research and classification.
- Data Exploration in Data Science: In data science and analytics, sequence sunburst visualizations can be used to explore hierarchical datasets. Users can analyze the relationships between different variables, dimensions, or clusters, helping to uncover insights, patterns, and trends within the data.
- Process Visualization and Workflow Analysis: Sequence sunburst visualizations can represent process hierarchies and workflows in various industries, such as manufacturing, logistics, and project management. Users can explore different stages, subprocesses, and dependencies within a workflow, facilitating process analysis, optimization, and decision-making.
- Educational Visualization: Sequence sunburst visualizations can be used in educational settings to teach hierarchical concepts, such as organizational structures, taxonomic classifications, or website navigation principles. Students can interactively explore hierarchical relationships and deepen their understanding of complex topics.
Overall, sequence sunburst visualizations find uses across a wide range of industries and applications, including organizational structure visualization, website navigation design, product categorization, biological taxonomy, data exploration, process visualization, workflow analysis, and educational visualization.

Reviews
There are no reviews yet.