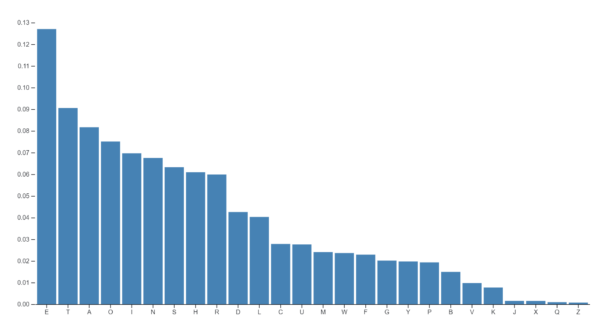
A zoomable bar chart is an interactive visualization that allows users to explore data by zooming in and out of specific sections or data points. It presents data in a bar graph format, with each bar representing a numerical value. Users can dynamically zoom in to focus on detailed information while maintaining an overall view of the dataset, enhancing data exploration and analysis.
Purposes :
The purposes of a zoomable chart include:
Detailed Data Exploration: Zoomable charts enable users to explore large datasets in detail by zooming in and out of specific regions or data points. This facilitates a deeper understanding of the data and allows users to identify trends, patterns, and outliers.
Interactive Analysis: Users can interact with zoomable charts to perform interactive analysis, such as comparing different data points, examining correlations, and exploring relationships within the dataset. The ability to zoom provides a more granular view of the data, enhancing analysis capabilities.
Contextual Understanding: Zoomable charts help users gain a contextual understanding of the data by allowing them to zoom out to see the big picture and zoom in to examine specific details. This helps users make informed decisions and draw meaningful insights from the data.
User-Friendly Visualization: Zoomable charts provide a user-friendly visualization interface that allows users to interact with the data intuitively. Users can easily navigate through the data using familiar zooming gestures, making the visualization accessible to a wide range of users.
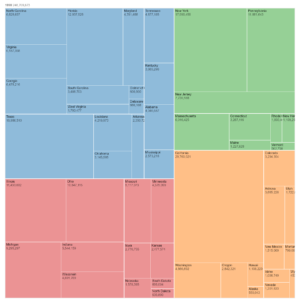
Hierarchical Data Visualization: For datasets with hierarchical structures, such as nested categories or subgroups, zoomable charts provide an effective way to visualize the data at different levels of granularity. Users can zoom in to explore lower-level categories while maintaining an understanding of the overall hierarchy.
Presentation and Communication: Zoomable charts are useful for presenting and communicating complex data to stakeholders, clients, or colleagues. The interactive nature of the charts allows presenters to engage the audience and convey key insights effectively.
Overall, the purposes of a zoomable chart include facilitating detailed data exploration, supporting interactive analysis, providing contextual understanding, offering user-friendly visualization, visualizing hierarchical data, and aiding presentation and communication of insights.
Uses :
The uses of a zoomable bar chart include:
Data Exploration: Users can explore large datasets by zooming in and out of specific regions or data points within the chart. This allows for detailed examination of data while maintaining an overall view of the dataset.
Interactive Analysis: Zoomable bar charts enable users to perform interactive analysis by comparing different data points, identifying trends, and exploring relationships within the dataset. The ability to zoom provides a more granular view of the data, enhancing analysis capabilities.
Contextual Understanding: Users can gain a contextual understanding of the data by zooming out to see the big picture and zooming in to examine specific details. This helps users make informed decisions and draw meaningful insights from the data.
Hierarchical Data Visualization: For datasets with hierarchical structures, such as nested categories or subgroups, zoomable bar charts provide an effective way to visualize the data at different levels of granularity. Users can zoom in to explore lower-level categories while maintaining an understanding of the overall hierarchy.
User-Friendly Visualization: Zoomable bar charts provide a user-friendly visualization interface that allows users to interact with the data intuitively. Users can easily navigate through the data using familiar zooming gestures, making the visualization accessible to a wide range of users.
Presentation and Communication: Zoomable bar charts are useful for presenting and communicating complex data to stakeholders, clients, or colleagues. The interactive nature of the charts allows presenters to engage the audience and convey key insights effectively.
Overall, zoomable bar charts are versatile tools that support detailed data exploration, interactive analysis, contextual understanding, hierarchical data visualization, user-friendly visualization, and presentation and communication of insights. They find applications in various domains and industries where visualization and analysis of data are essential.
Reviews
There are no reviews yet.
Only logged in customers who have purchased this product may leave a review.

Reviews
There are no reviews yet.