Description
Description :
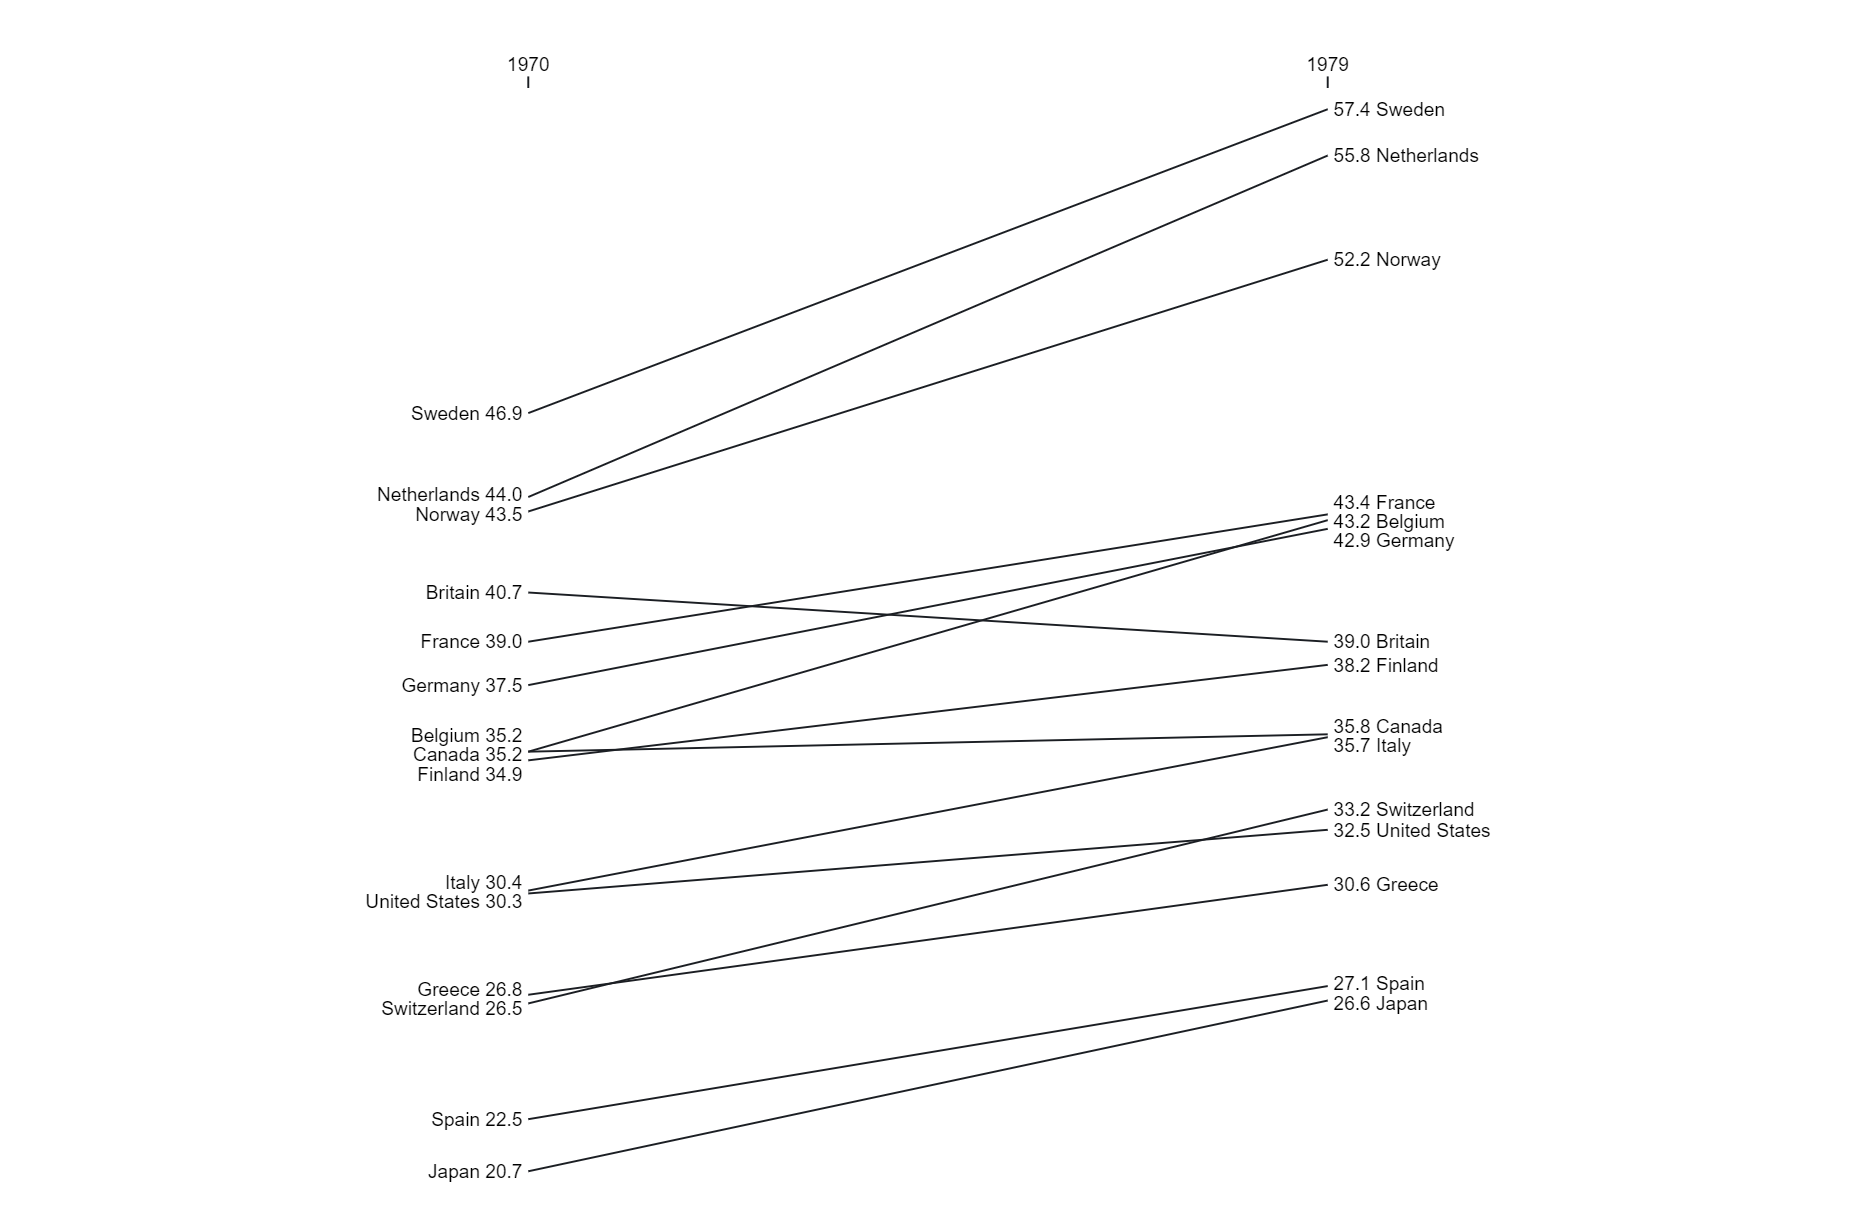
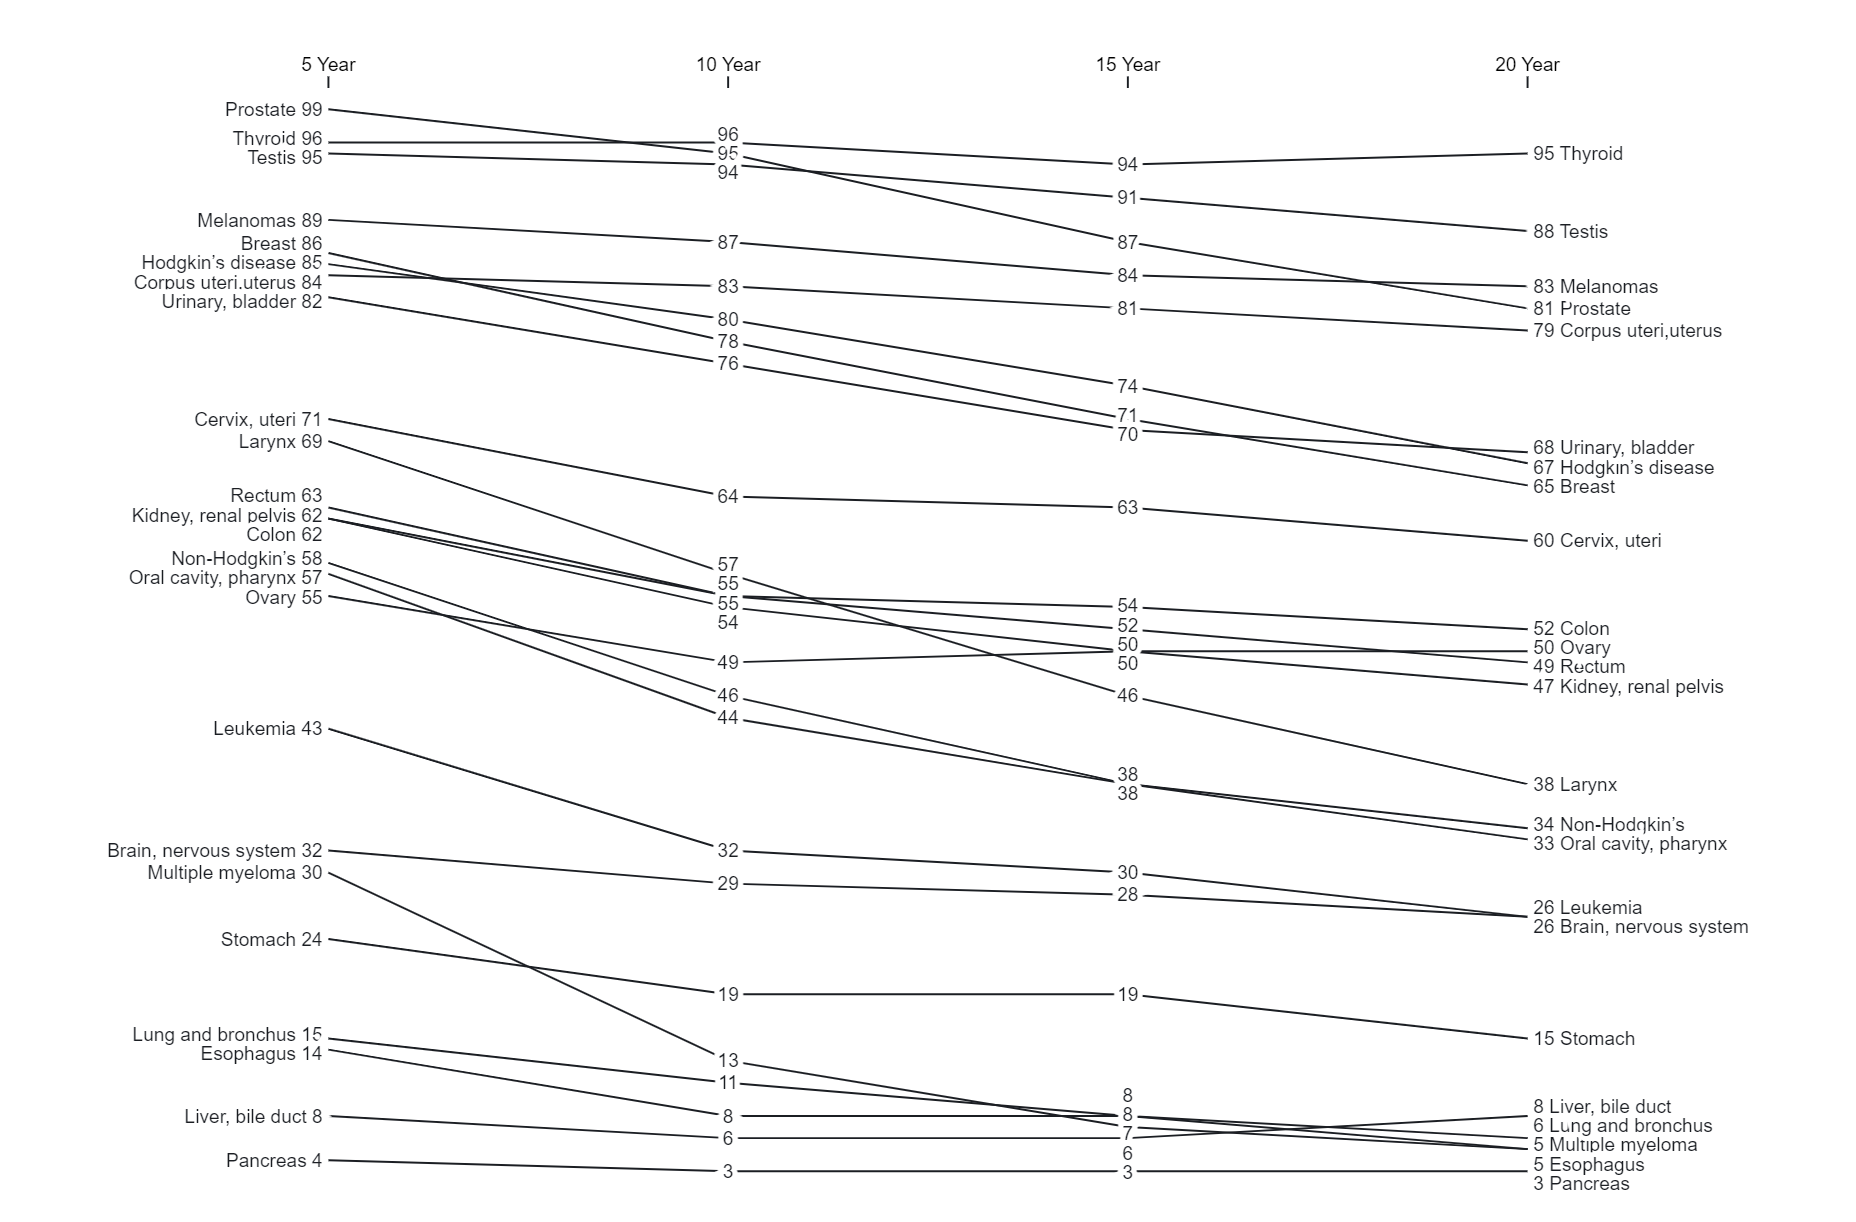
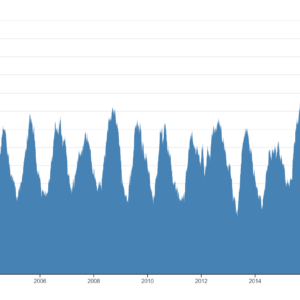
A cancer survival rates line chart visually displays the percentage of individuals surviving a specific type of cancer over time. Time since diagnosis is typically represented on the horizontal axis (x-axis), while the vertical axis (y-axis) shows the percentage of patients who are still alive at each time interval. Each line on the chart represents a different category of cancer (e.g., by type, stage, or treatment), showing how survival rates change over time for each category. These charts provide valuable insights into long-term survival outcomes, helping healthcare professionals, researchers, and patients understand the effectiveness of cancer treatments and make informed decisions about care.
Purposes :
The uses of cancer survival line charts include:
- Assessing Treatment Efficacy: Cancer survival line charts help evaluate the effectiveness of various cancer treatments over time, enabling healthcare professionals to assess which treatments result in better long-term survival outcomes for patients.
- Comparing Survival Rates: These charts allow for the comparison of survival rates between different types of cancer, cancer stages, or treatment modalities. This comparative analysis aids in identifying trends, disparities, and areas for improvement in cancer care.
- Predicting Prognosis: By examining survival trends on the chart, healthcare providers can estimate the prognosis of patients with specific cancer types or stages, helping to guide treatment decisions and discussions with patients and their families.
- Monitoring Progress: Cancer survival line charts serve as a tool for monitoring progress in cancer care and treatment over time. They provide visual feedback on changes in survival rates, allowing healthcare providers to track improvements or identify areas where further interventions are needed.
- Informing Policy Decisions: Policymakers and public health officials use cancer survival line charts to inform decisions related to cancer screening programs, allocation of resources, and implementation of interventions aimed at improving cancer outcomes at the population level.
- Supporting Research: Researchers utilize cancer survival line charts to investigate trends in cancer survival rates, identify factors influencing survival outcomes, and develop strategies for improving cancer care and patient outcomes through clinical trials and studies.
- Educating Patients: Cancer survival line charts can be used to educate patients about their prognosis, treatment options, and potential outcomes. Visual representations of survival rates help patients and their families understand the likelihood of survival at different stages of the disease.
Overall, cancer survival line charts are valuable tools for assessing treatment efficacy, comparing survival rates, predicting prognosis, monitoring progress, informing policy decisions, supporting research, and educating patients about cancer outcomes.
Only logged in customers who have purchased this product may leave a review.
Related products
-
- Sale!
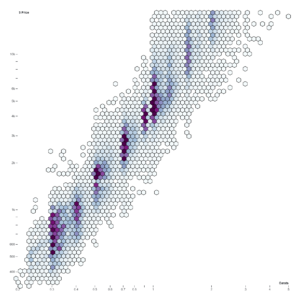
Hexbin
- Original price was: $ 15.$ 10Current price is: $ 10.
- Add to cart
-
- Sale!
Moving Average Chart
- Original price was: $ 15.$ 10Current price is: $ 10.
- Add to cart
-
- Sale!
Circle Packing
- Original price was: $ 15.$ 10Current price is: $ 10.
- Add to cart
Reviews
There are no reviews yet.