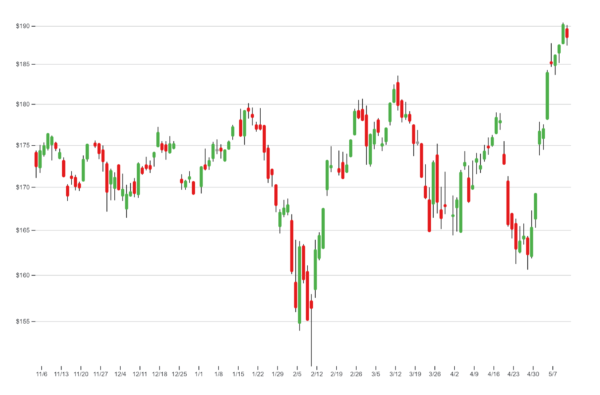
A candlestick chart is a type of financial chart used to represent the price movements of a financial instrument, such as stocks or currencies, over a specific period. Each candlestick on the chart shows the opening, closing, high, and low prices for that period. The body of the candlestick represents the price range between the opening and closing prices, while the wicks (lines extending from the top and bottom) indicate the highest and lowest prices reached during the period. Candlestick charts are widely used by traders and analysts to analyze price trends, identify patterns, and make informed trading decisions.
Purposes :
Visualizing Price Movements: Candlestick charts provide a visual representation of price movements over a specified time period, allowing traders and analysts to quickly assess the direction and magnitude of price changes.
Identifying Trends: Candlestick patterns can help traders identify trends in the market, such as uptrends, downtrends, or sideways movements. Patterns like “bullish” (upward) and “bearish” (downward) engulfing patterns or “doji” candles provide clues about potential shifts in market sentiment.
Analyzing Market Sentiment: Candlestick charts help traders gauge market sentiment by observing the patterns and shapes formed by the candlesticks. For example, long upper shadows on candles suggest selling pressure, while long lower shadows indicate buying pressure.
Determining Support and Resistance Levels: Traders use candlestick charts to identify key support and resistance levels, which are levels where the price tends to bounce off or reverse direction. These levels are important for making trading decisions and setting entry and exit points.
Spotting Reversal Signals: Candlestick patterns like “hammer,” “shooting star,” or “evening star” can indicate potential reversals in the market trend. Recognizing these patterns early can help traders anticipate changes in direction and adjust their trading strategies accordingly.
Timing Entry and Exit Points: Candlestick charts assist traders in timing their entry and exit points for trades. By analyzing candlestick patterns and formations, traders can determine optimal times to buy or sell financial instruments.
Risk Management: Candlestick charts help traders manage risk by providing insights into potential price movements and market volatility. Traders can use stop-loss orders and other risk management techniques based on their analysis of candlestick patterns.
Overall, candlestick charts serve as valuable tools for traders and analysts to understand market dynamics, identify trading opportunities, and make informed decisions in the financial markets.
Uses :
Candlestick charts serve several key purposes in financial analysis and trading:
Visualizing Price Movements: Candlestick charts provide a visual representation of price movements over a specific time period, allowing traders to quickly assess whether prices have risen, fallen, or remained relatively unchanged.
Identifying Trends: Traders use candlestick patterns to identify trends in price movements, such as uptrends, downtrends, or periods of consolidation. By analyzing the shape and arrangement of candlesticks, traders can gauge market sentiment and anticipate future price movements.
Spotting Reversal Signals: Candlestick patterns can signal potential reversals in price trends. Reversal patterns, such as “hammer” and “shooting star” formations, indicate shifts in market sentiment and provide traders with opportunities to enter or exit positions at favorable prices.
Determining Support and Resistance Levels: Candlestick charts help traders identify key support and resistance levels, which are price levels where buying or selling pressure is expected to increase. These levels serve as important reference points for making trading decisions.
Analyzing Market Psychology: Candlestick patterns reflect the collective psychology of market participants. By interpreting the size, color, and arrangement of candlesticks, traders can gain insights into market sentiment, investor behavior, and potential market reactions.
Timing Entry and Exit Points: Traders use candlestick patterns to time their entry and exit points in the market. By waiting for confirmation from specific candlestick patterns, traders can increase the probability of successful trades and minimize the risk of entering or exiting prematurely.
Risk Management: Candlestick charts help traders manage risk by providing insights into potential price movements and identifying levels where stop-loss orders can be placed to limit losses. Traders can adjust their risk management strategies based on the patterns and signals observed on candlestick charts.
Overall, candlestick charts are valuable tools for technical analysis and trading, providing traders with actionable insights into price movements, trends, reversals, support and resistance levels, and market psychology.
Reviews
There are no reviews yet.
Only logged in customers who have purchased this product may leave a review.

Reviews
There are no reviews yet.