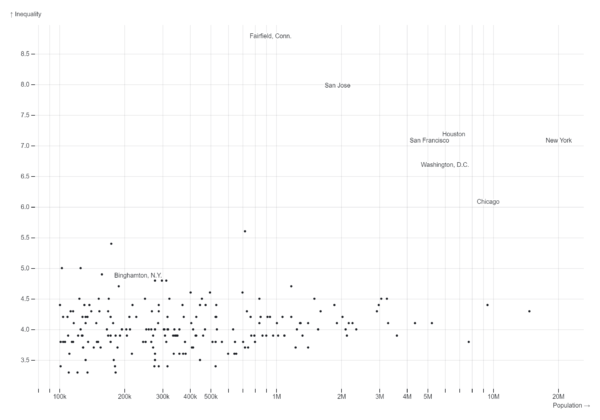
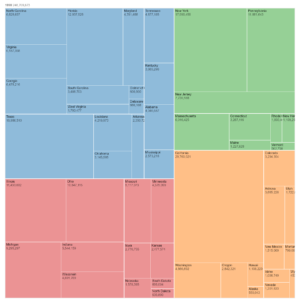
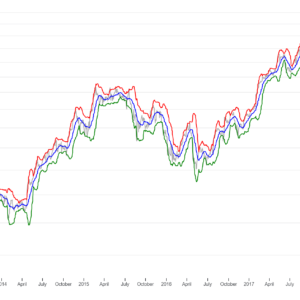
A line chart depicting inequalities in American cities visually represents variations in socio-economic disparities over time. By plotting data points for various indicators such as income inequality, educational attainment gaps, or access to resources, the chart illustrates how these disparities have evolved within urban areas over a specific period. It provides a clear and concise snapshot of the changing landscape of inequality, helping policymakers, researchers, and the public understand the magnitude and trajectory of social and economic disparities within American cities.
Purpose :
The purpose of a line chart depicting inequalities in American cities is multifaceted:
Visual Representation: It provides a visual representation of socio-economic disparities within American cities, making complex data more accessible and understandable to a wide audience.
Trend Analysis: By plotting data over time, the chart allows for the identification of trends and patterns in inequality, such as whether disparities are increasing, decreasing, or remaining stable.
Comparison: It enables comparisons between different cities or regions, highlighting variations in inequality levels and trends across urban areas.
Policy Evaluation: The chart serves as a tool for evaluating the effectiveness of policies and interventions aimed at reducing inequality within cities. Policymakers can assess whether initiatives are having the desired impact and adjust strategies accordingly.
Awareness and Advocacy: It raises awareness about socio-economic disparities within American cities, fostering public dialogue and advocacy efforts aimed at addressing inequality and promoting social justice.
Informing Decision-Making: The chart provides valuable insights for decision-makers in government, nonprofits, and the private sector, helping them prioritize resources and develop targeted interventions to address the most pressing issues related to inequality.
Research and Analysis: Researchers can use the chart to conduct in-depth analysis of inequality dynamics within American cities, exploring factors contributing to disparities and identifying potential solutions.
Overall, the line chart of inequalities in American cities serves as a powerful tool for understanding, addressing, and advocating for social and economic equity within urban areas.
Uses :
A line chart depicting inequalities in American cities can be utilized in various ways:
Policy Development: It informs policymakers about the extent and trends of socio-economic disparities within cities, aiding in the formulation of targeted policies and programs to address inequality.
Resource Allocation: The chart assists in the allocation of resources by highlighting areas or communities within cities that are disproportionately affected by inequality, allowing for more equitable distribution of resources.
Community Engagement: It serves as a tool for community engagement and advocacy, empowering residents to advocate for policies and initiatives aimed at reducing inequality and promoting social justice.
Program Evaluation: Organizations and government agencies can use the chart to evaluate the effectiveness of existing programs and interventions aimed at reducing inequality, identifying areas for improvement or expansion.
Research and Analysis: Researchers can analyze the data presented in the chart to conduct in-depth studies on the root causes of inequality within American cities, informing academic research and policy debates.
Education and Awareness: The chart can be used in educational settings to raise awareness among students and the general public about the prevalence and impact of socio-economic disparities within cities.
Benchmarking: It provides a benchmark for tracking progress over time in addressing inequality within cities, allowing stakeholders to monitor the effectiveness of efforts aimed at reducing disparities.
Overall, the line chart of inequalities in American cities serves as a valuable tool for informing decision-making, promoting social equity, and fostering community empowerment and engagement.
Reviews
There are no reviews yet.
Only logged in customers who have purchased this product may leave a review.

Reviews
There are no reviews yet.