Sale!
Description
Description :
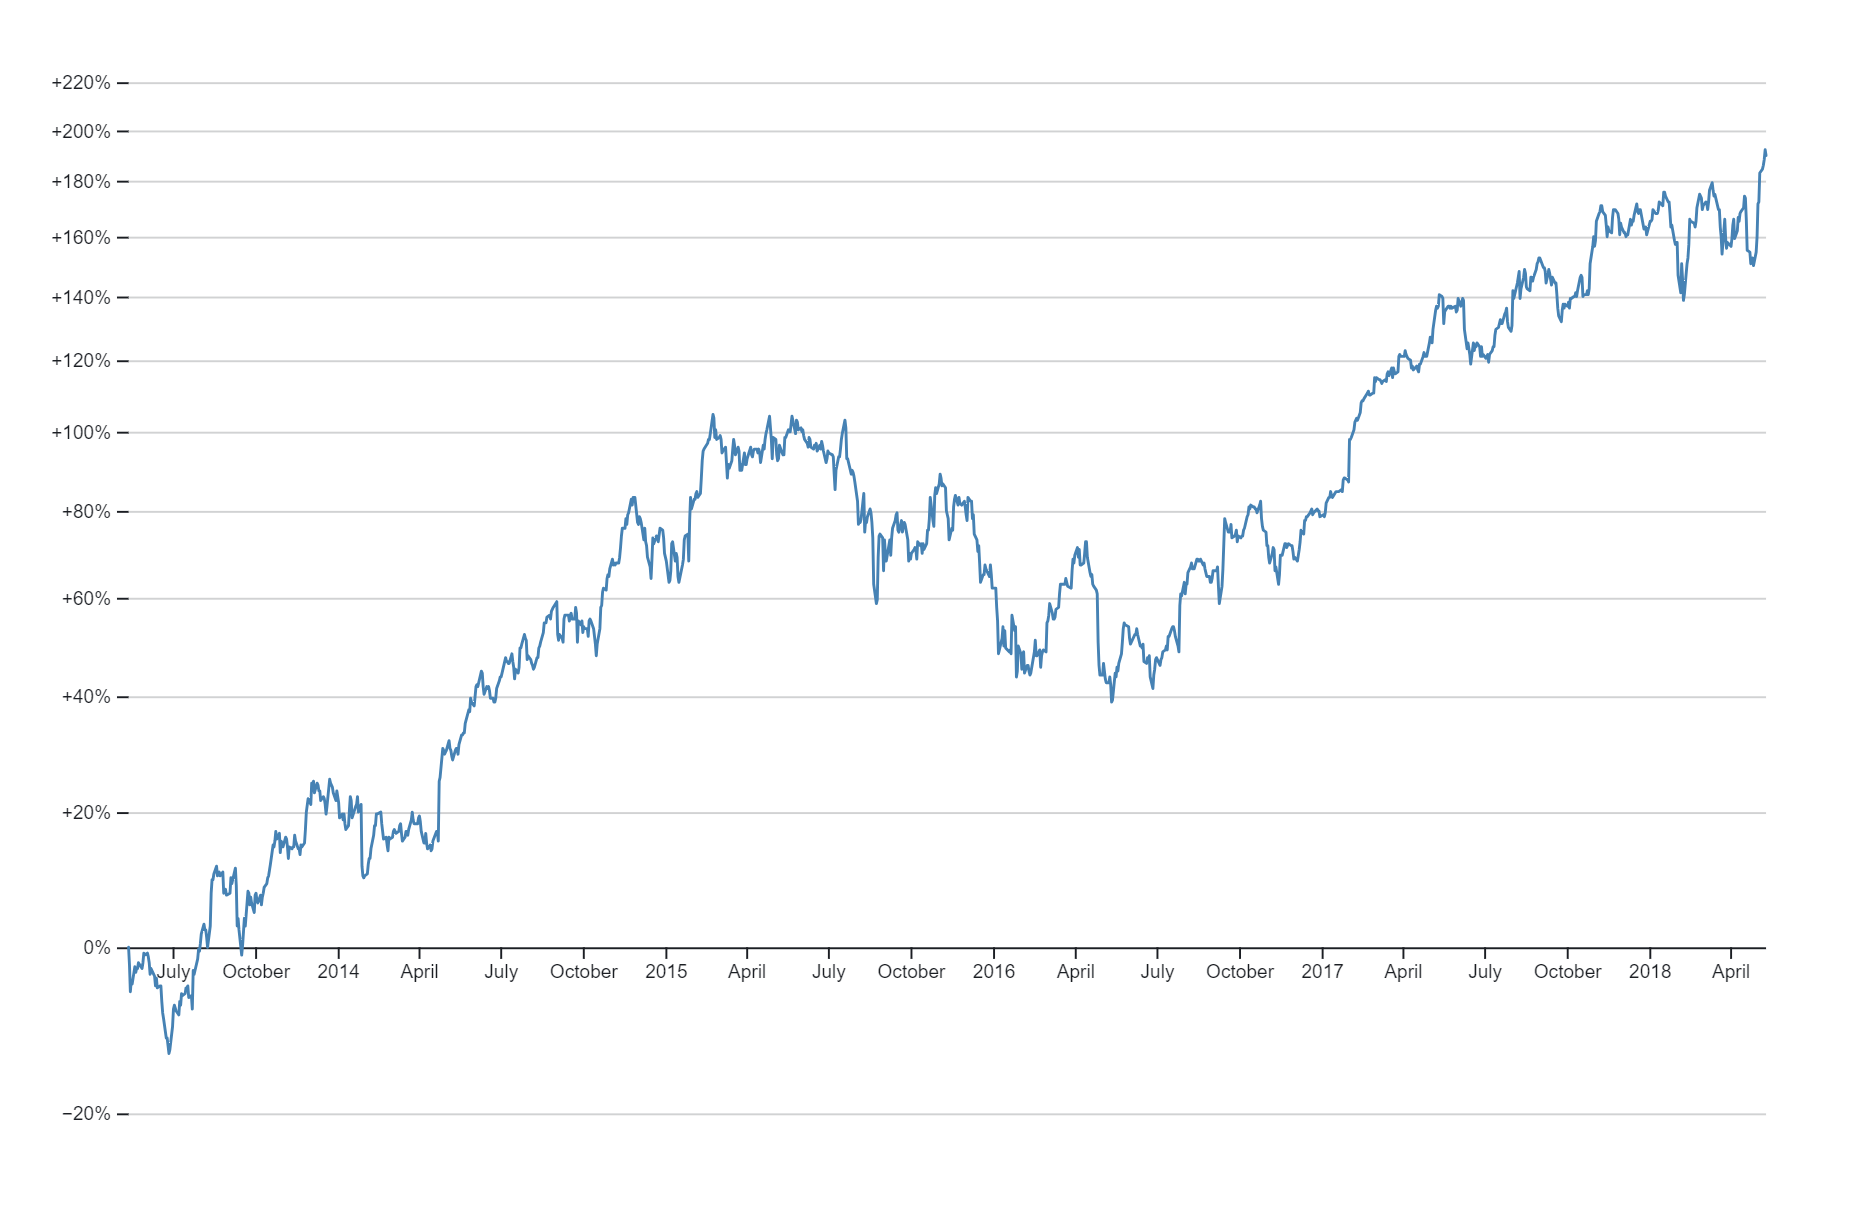
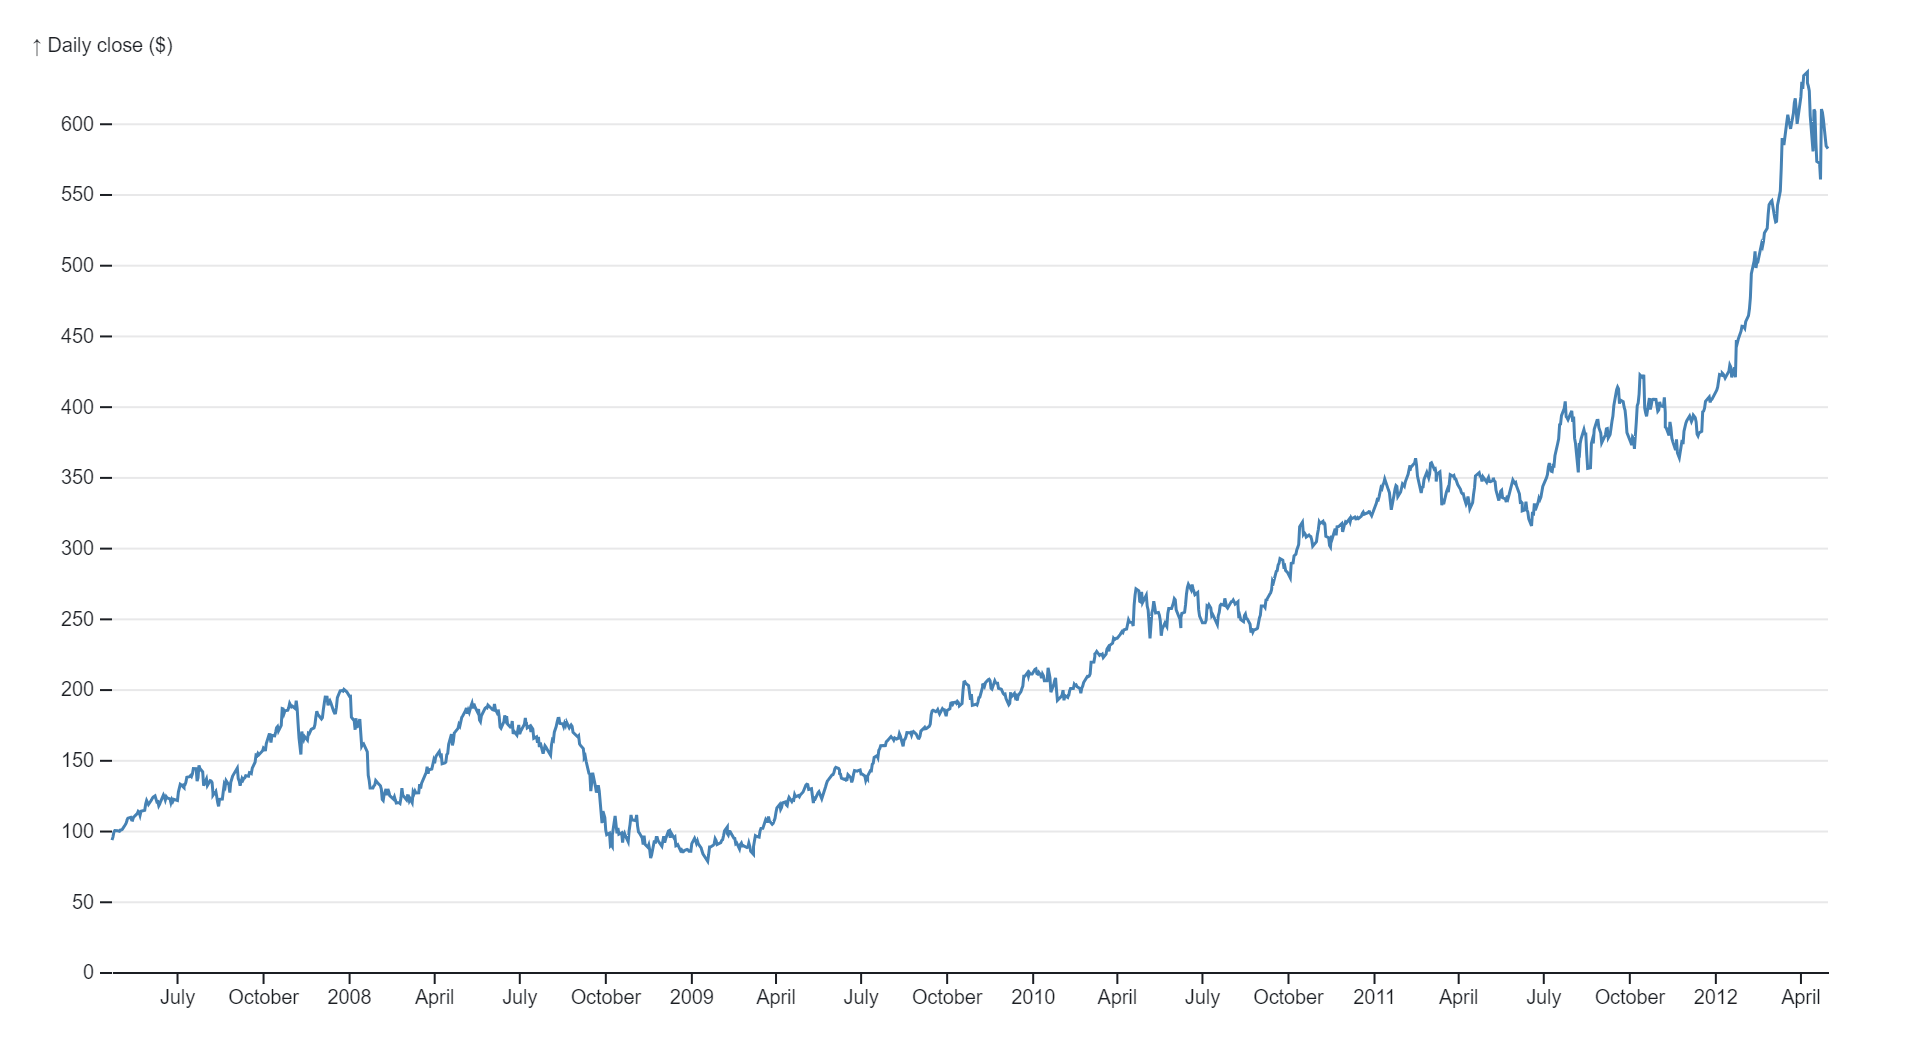
A line chart is a type of data visualization that represents information using a series of data points connected by straight lines. It typically consists of two axes: a horizontal axis (X-axis) that represents the independent variable, such as time or categories, and a vertical axis (Y-axis) that represents the dependent variable or variables being measured. Line charts are commonly used to visualize trends, patterns, or relationships in data over time or across different categories. They provide a clear and concise way to interpret data and identify changes or fluctuations in values.
Purpose :
Uses :
Only logged in customers who have purchased this product may leave a review.

Reviews
There are no reviews yet.