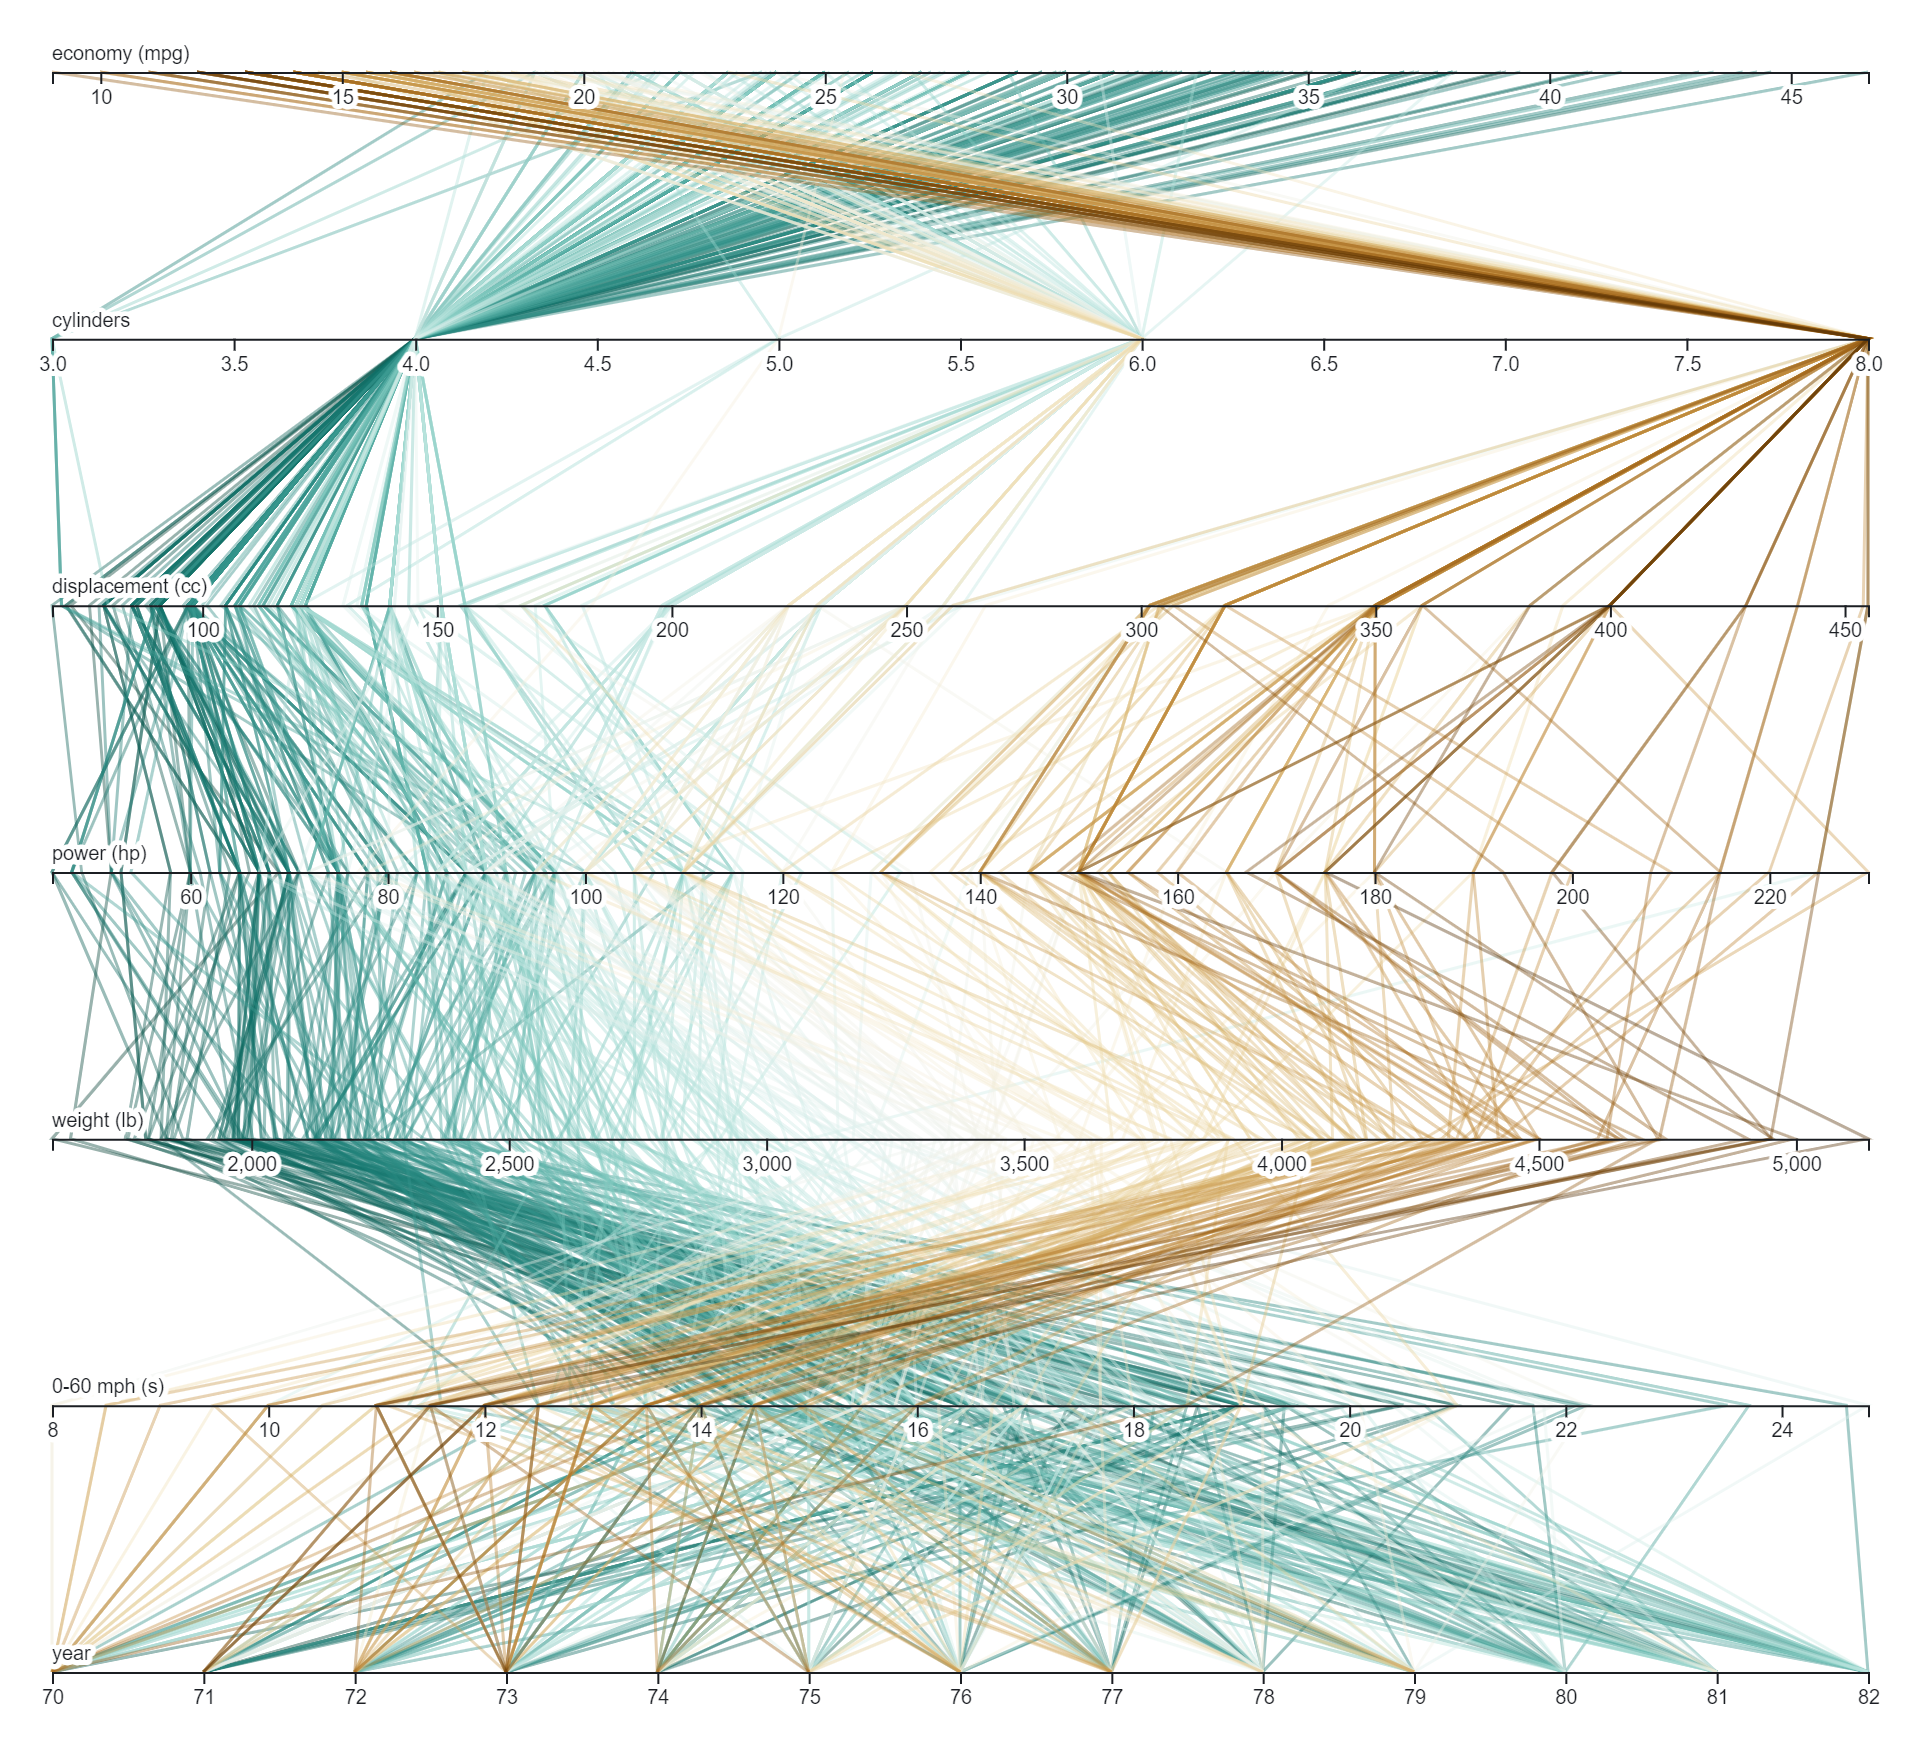
The purpose of a parallel coordinates line chart is to visually represent and analyze multivariate data in a two-dimensional space. Some key purposes include:
- Identifying Patterns: It allows for the identification of patterns, trends, and relationships across multiple variables simultaneously, enabling analysts to uncover complex insights within the data.
- Correlation Analysis: By observing the behavior of lines as they intersect and converge, analysts can assess correlations between different variables, helping to understand how they interact with each other.
- Outlier Detection: Parallel coordinates charts facilitate the detection of outliers or anomalous data points by visually inspecting deviations from the general trend of the data.
- Data Exploration: It provides a comprehensive overview of the dataset, allowing users to explore the distribution and spread of values across multiple dimensions and identify interesting subsets for further analysis.
- Dimensionality Reduction: Parallel coordinates charts can aid in reducing the dimensionality of complex datasets while preserving important information, making it easier to interpret and analyze large amounts of data.
- Comparative Analysis: Users can compare the relationships between variables for different subsets or categories within the data, enabling comparative analysis across various groups or time periods.
Overall, the purpose of a parallel coordinates line chart is to facilitate visual exploration, analysis, and interpretation of multivariate data, helping users gain valuable insights and make informed decisions based on their findings.

Reviews
There are no reviews yet.