Sale!

Variable -color line

Original price was: $ 15.Current price is: $ 10.

Description

A variable color line chart is a type of data visualization where the color of the line changes based on the values of a specific variable. Each data point on the line is represented by a color that corresponds to the value of the variable at that point. This technique adds an extra dimension to the visualization, allowing viewers to perceive patterns, trends, or relationships between variables more easily. Variable color line charts are commonly used in fields such as data analysis, finance, and scientific research to highlight changes or anomalies in the data and facilitate interpretation .

Purpose :

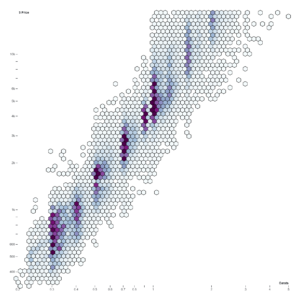
The purposes of using a variable color line chart include:

  1. Highlighting Trends: Variable color line charts help to highlight trends or patterns in the data by changing the color of the line based on the values of a specific variable. This makes it easier for viewers to identify and understand trends over time or across different categories.
  2. Visualizing Relationships: By encoding the line with different colors based on the values of a related variable, variable color line charts can visualize relationships between variables. This allows viewers to see how changes in one variable correlate with changes in another.
  3. Identifying Anomalies: Variable color line charts can be used to identify anomalies or outliers in the data by visually highlighting data points with unusual values. This makes it easier for viewers to spot irregularities and investigate potential causes.
  4. Improving Interpretation: By adding an extra dimension to the visualization, variable color line charts make it easier for viewers to interpret complex data sets. The use of color helps to convey information quickly and intuitively, enhancing understanding.
  5. Enhancing Communication: Variable color line charts are visually appealing and can help to engage viewers more effectively. By presenting data in a visually compelling way, these charts can improve communication and make presentations more impactful.
  6. Facilitating Comparison: Variable color line charts allow viewers to compare data across different variables or categories more easily. By visually distinguishing between different segments of the data, these charts make it easier to identify similarities and differences.
Uses  :
  1. Trend Analysis: Variable color line charts are effective for visualizing trends over time or across categories by encoding the line with different colors corresponding to varying data values. This helps users quickly identify and analyze trends within the data.
  2. Comparative Analysis: They allow for easy comparison of multiple variables or categories by assigning different colors to each. Users can identify similarities, differences, or patterns across the variables, facilitating comparative analysis.
  3. Correlation Assessment: Variable color line charts help users assess correlations between variables. By visually mapping the relationship between variables with different colors, users can identify if changes in one variable are associated with changes in another.
  4. Anomaly Detection: These charts facilitate the detection of anomalies or outliers within the data. Deviations from the expected trend are easily noticeable when they are represented by distinct colors, aiding in anomaly detection and investigation.
  5. Enhanced Interpretation: Variable color line charts enhance data interpretation by providing a visually rich representation of complex datasets. The use of color variation helps users better understand and interpret the data, leading to more insightful analysis.
  6. Communication of Insights: They serve as effective tools for communicating insights and findings to stakeholders or audiences. The visual appeal and clarity of variable color line charts make it easier to convey complex information in an accessible format.
  7. Interactive Exploration: Variable color line charts can be used in interactive visualizations, allowing users to dynamically explore the data. Users can interact with the chart to focus on specific variables, categories, or time periods of interest, enabling deeper exploration and analysis.
  8. Decision Support: These charts support decision-making processes by providing clear visual representations of data trends and patterns. Decision-makers can use insights derived from variable color line charts to inform strategies and actions.


Reviews

There are no reviews yet.

Only logged in customers who have purchased this product may leave a review.