Description
Description :
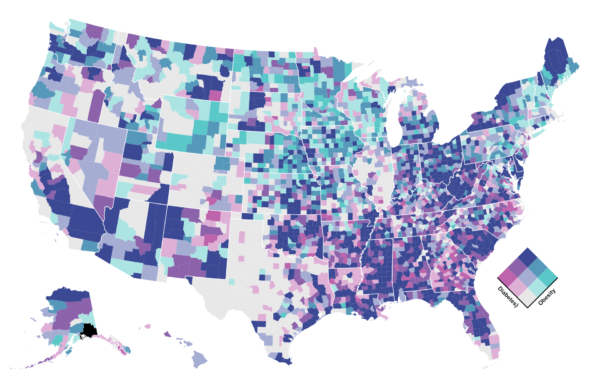
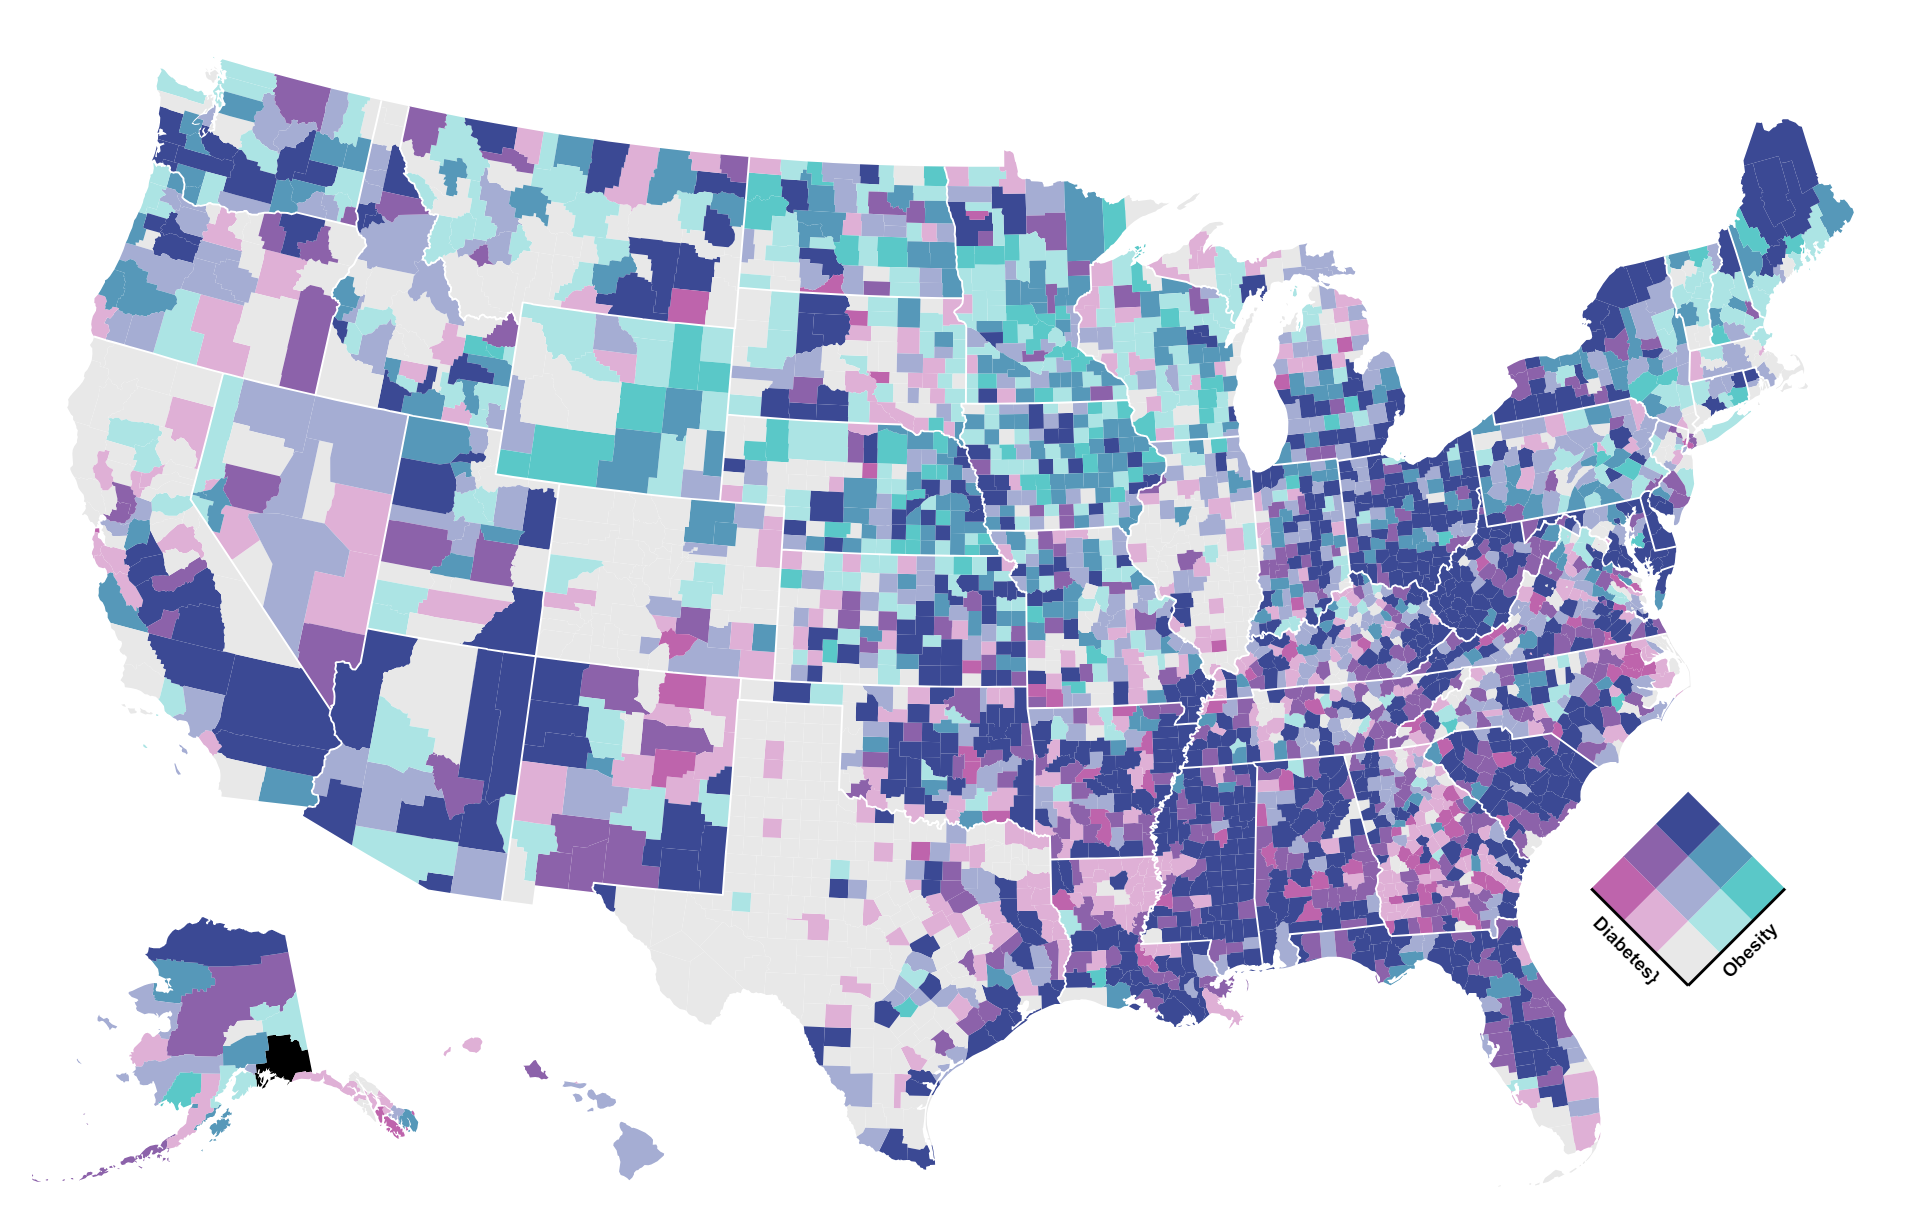
Bivariate choropleth maps display two distinct variables simultaneously across geographic regions, using color gradients or patterns to represent the values of each variable. These maps offer a visual representation of the relationship between the variables, aiding in the identification of spatial patterns and correlations.”
Purpose of Bevariate choropleth map
- Visualizing Relationships: Bivariate choropleth maps are useful for visualizing relationships between two variables, such as income and education level, population density and crime rate, or temperature and precipitation. By displaying both variables on the same map, users can easily identify spatial patterns and correlations.
- Identifying Hotspots and Coldspots: These maps can help identify geographic areas that exhibit high or low values for both variables simultaneously. Hotspots, where both variables are high, and coldspots, where both variables are low, can be identified and analyzed for various purposes such as targeting interventions or resource allocation.
- Comparing Spatial Patterns: Bivariate choropleth maps enable users to compare the spatial patterns of two variables within the same geographic area. This comparison can reveal interesting insights into how the variables interact or influence each other across different regions.
- Policy Planning and Decision Making: Policymakers, urban planners, and researchers can use bivariate choropleth maps to inform policy planning and decision-making processes. For example, these maps can help identify areas with high poverty rates and low access to education or healthcare, guiding targeted interventions and resource allocation.
- Communicating Complex Data: Bivariate choropleth maps offer an effective way to communicate complex data to a wide audience. By visualizing two variables simultaneously, they provide a clear and intuitive representation of spatial relationships that may be difficult to convey through text or tables alone.
- Geographic Analysis: Geographers and researchers use bivariate choropleth maps for geographic analysis, allowing them to explore spatial patterns, trends, and relationships between different variables within a geographic context.
Uses of bevariate choropleth map :
-
- Identifying Correlations: Bivariate choropleth maps allow users to identify correlations between two variables across geographical regions. For example, if one variable represents income levels and the other represents education levels, the map can show whether areas with higher income tend to have higher education levels, and vice versa.
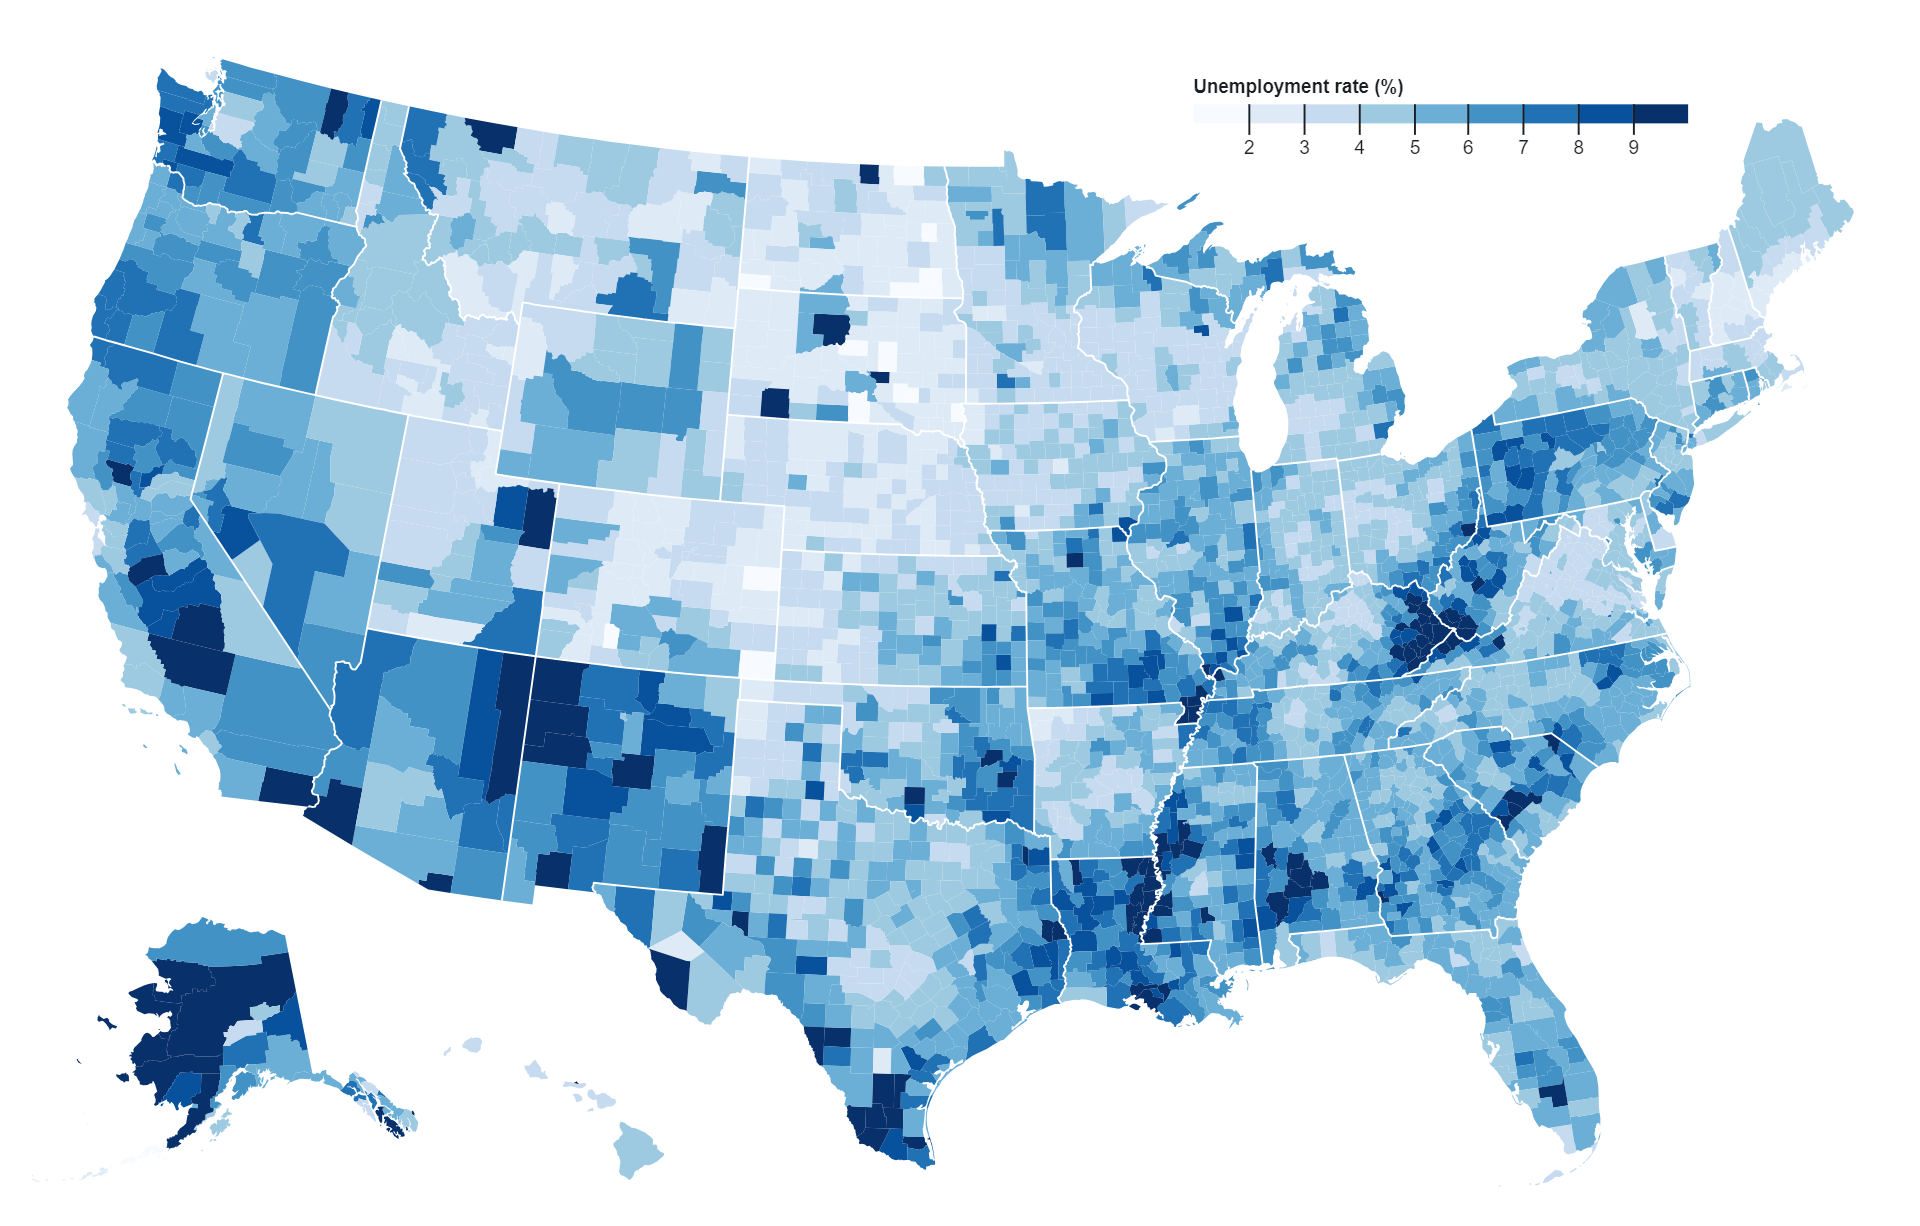
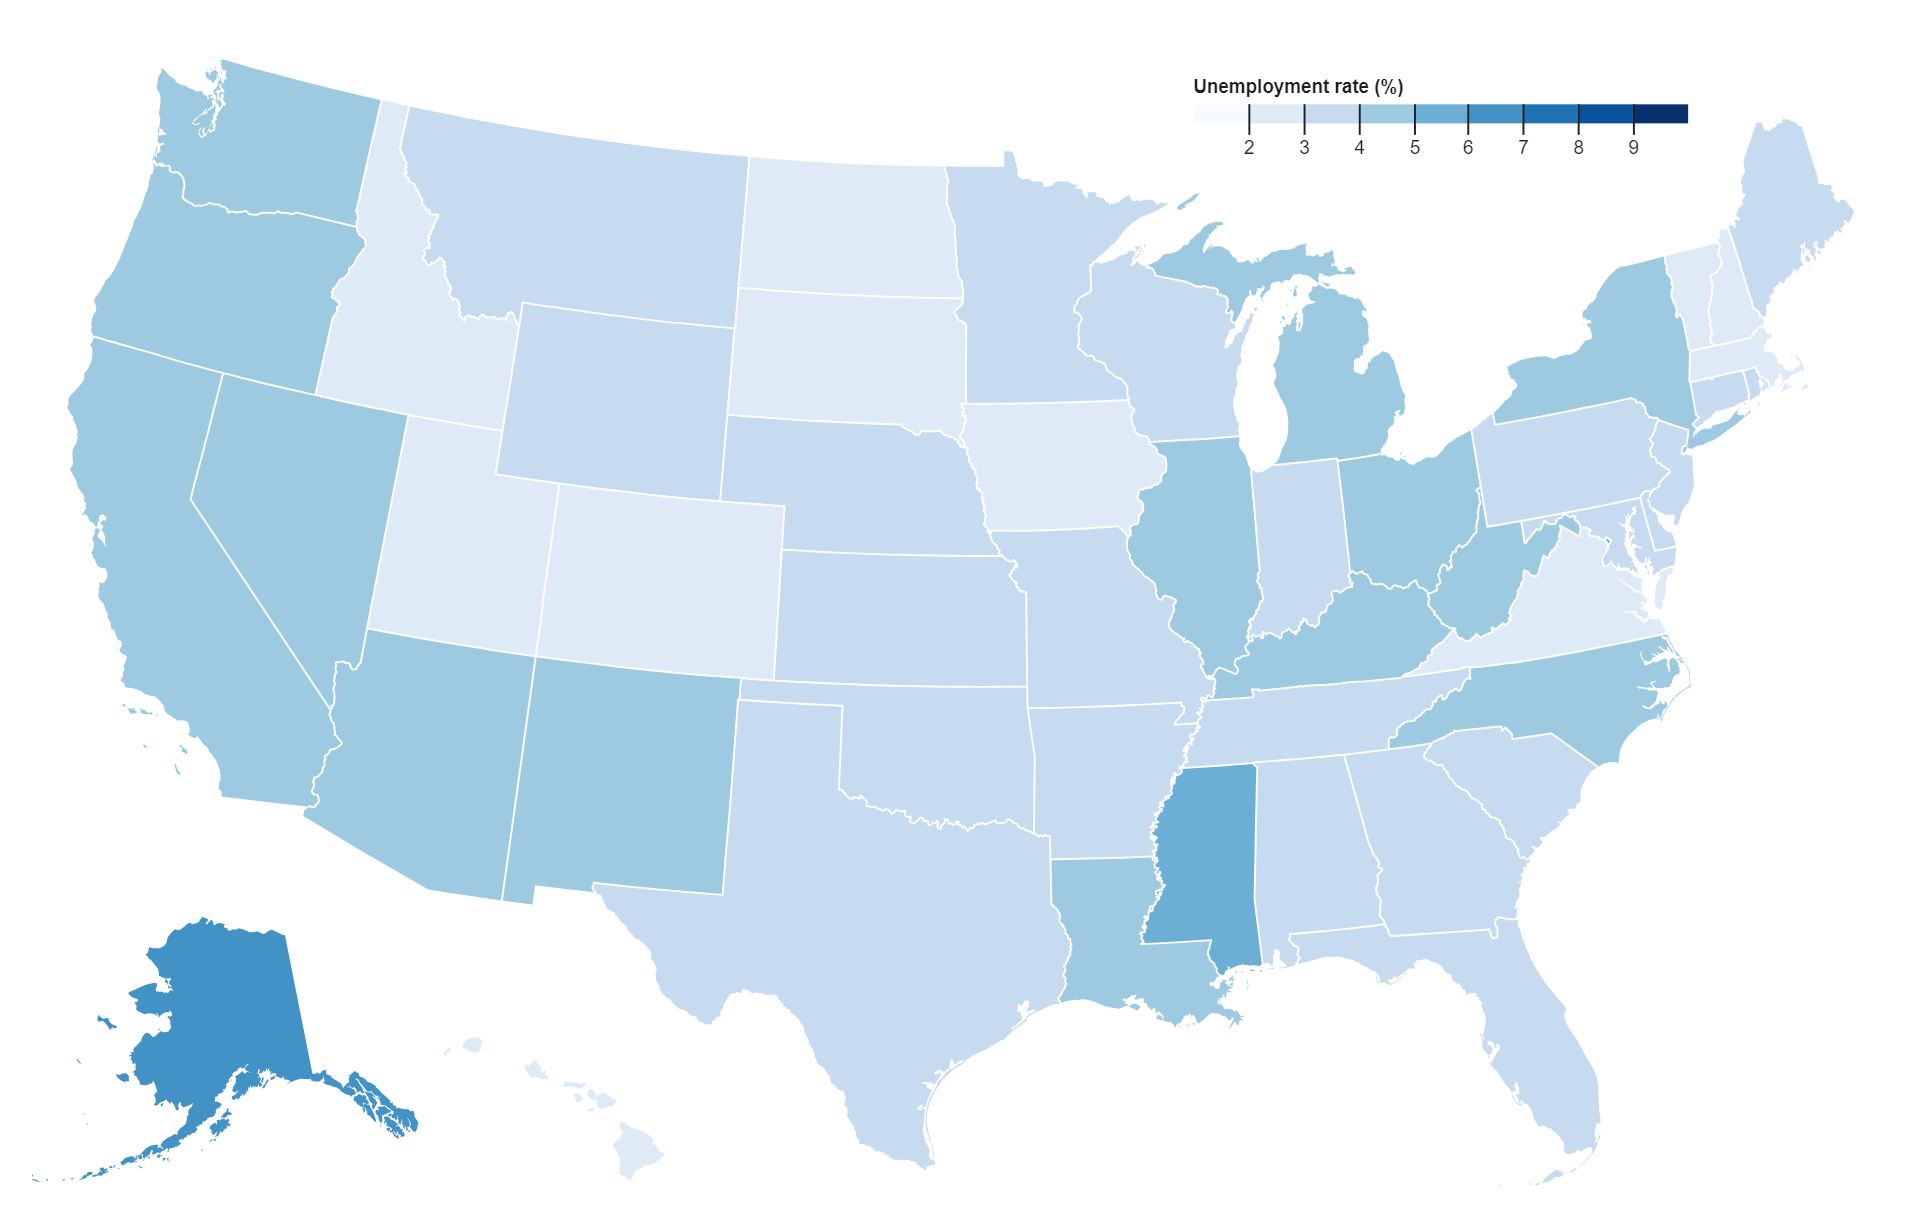
- Highlighting Disparities: These maps can highlight disparities between different regions in terms of two variables simultaneously. This can be useful for understanding social, economic, or environmental inequalities within a country, state, or other geographical area.
- Policy Planning and Decision Making: Policymakers can use bivariate choropleth maps to inform decision-making processes. For example, if a government is considering allocating resources for healthcare, the map can help identify areas where both healthcare access is low and health outcomes are poor, guiding resource allocation efforts.
- Urban Planning: Urban planners can use bivariate choropleth maps to understand patterns related to infrastructure, housing, transportation, and other urban features. For instance, such a map could help identify areas with high population density and low access to public transportation, indicating a need for transportation infrastructure improvements.
- Environmental Analysis: Environmental researchers and policymakers can use bivariate choropleth maps to analyze environmental data, such as air quality and population density. These maps can help identify areas where environmental issues intersect with social or economic factors, guiding environmental management strategies.
- Educational Purposes: Bivariate choropleth maps can be used in educational settings to teach students about spatial analysis, data visualization, and the relationships between different variables. Students can learn to interpret these maps to understand complex geographical phenomena.
- Research and Analysis: Researchers across various fields, including geography, sociology, economics, public health, and environmental science, can use bivariate choropleth maps to analyze spatial relationships, identify patterns, and generate hypotheses for further investigation.
Only logged in customers who have purchased this product may leave a review.
Reviews
There are no reviews yet.