A choropleth map is a type of statistical thematic map that uses pseudocolor, meaning color corresponding with an aggregate summary of a geographic characteristic within spatial enumeration units, such as population density or per-capita income.
Choropleth maps are widely used in various fields for visualizing spatial data. Here are some common uses:
Demographics: Choropleth maps can represent demographic data such as population density, age distribution, income levels, education levels, etc. This helps in understanding the characteristics of different regions.
Election Results: They are frequently used to visualize election results, showing voting patterns across different geographic areas. This can include maps showing which political party won in each region or the percentage of votes received by each candidate.
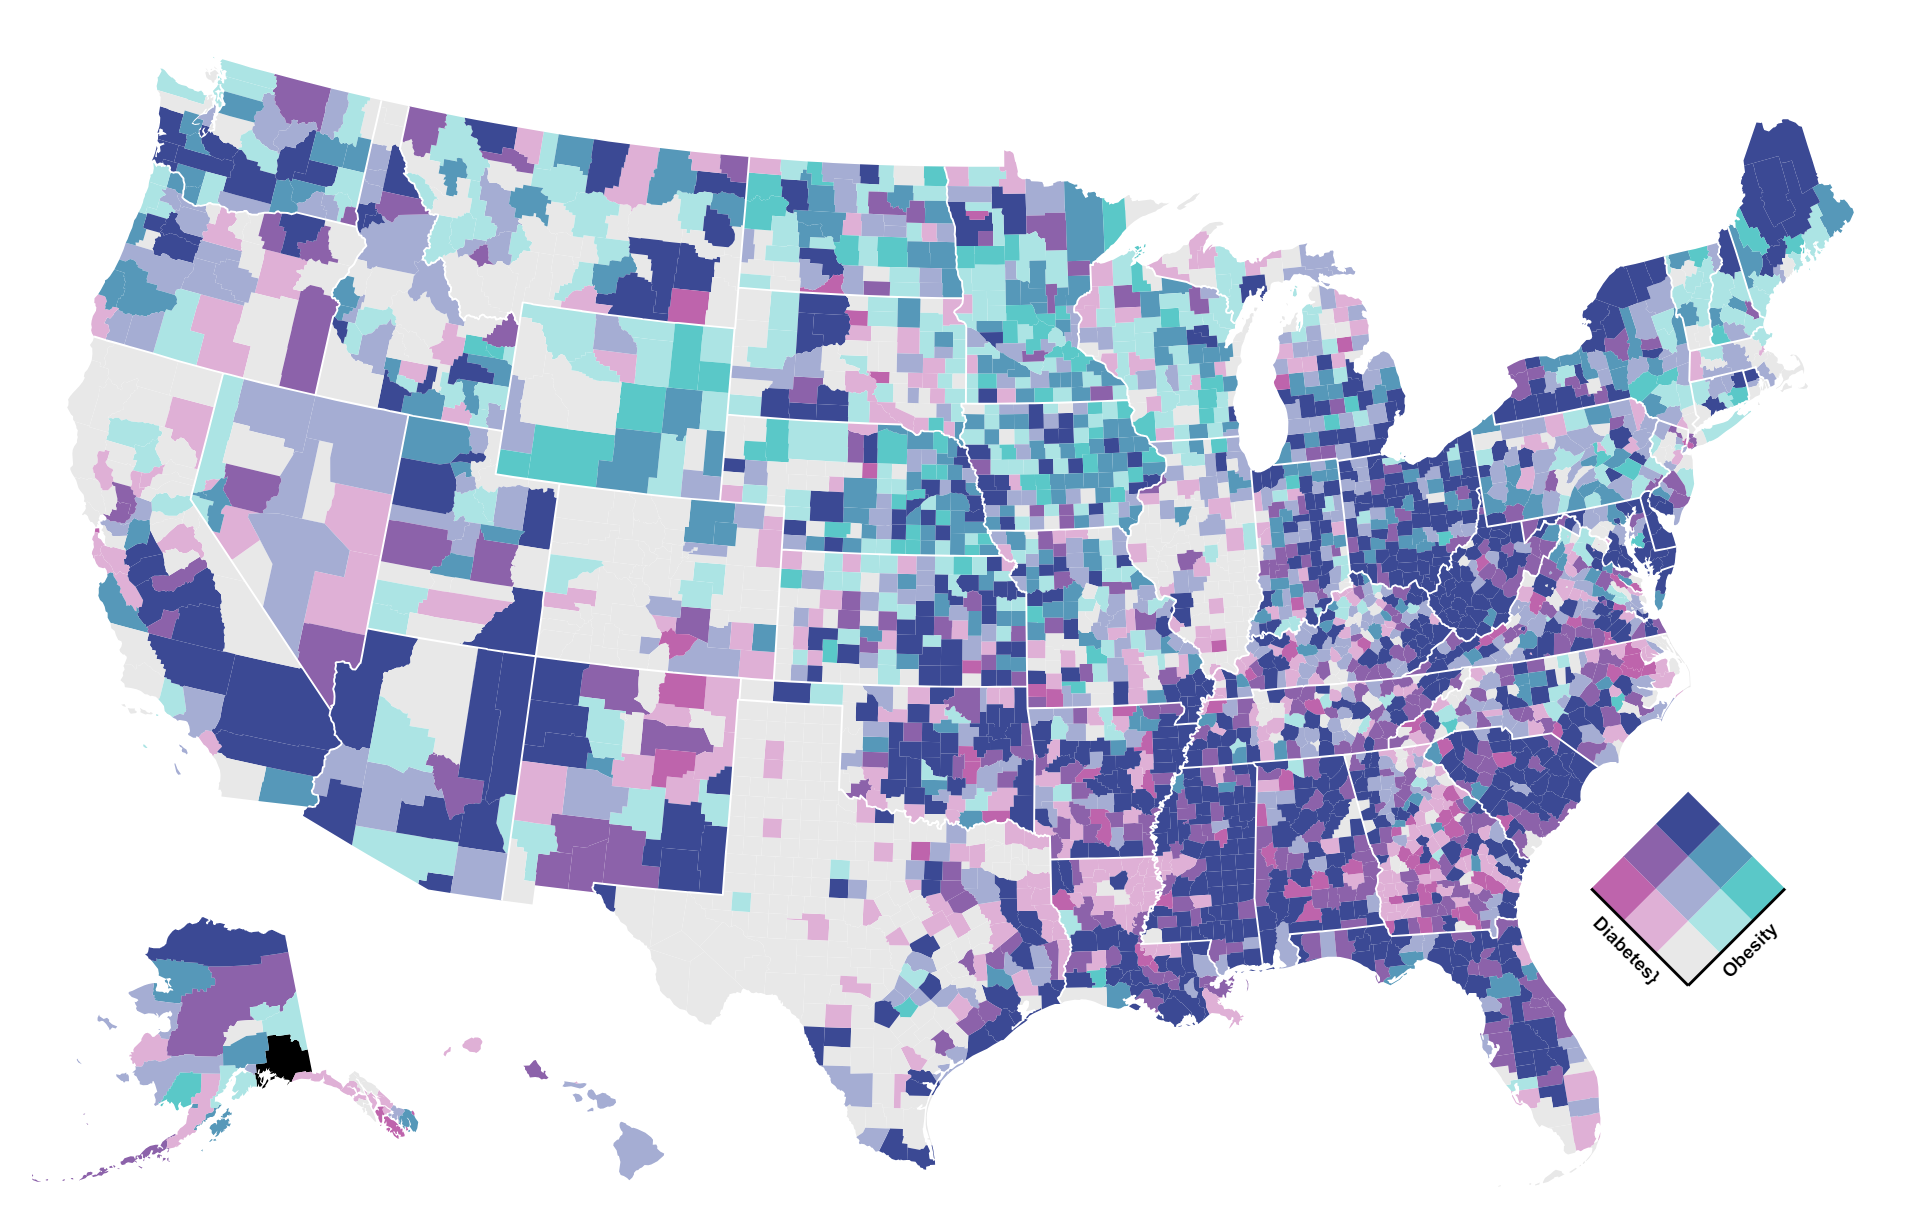
Healthcare: Choropleth maps can display health-related data such as disease prevalence, vaccination coverage, healthcare access, etc. This helps in identifying areas with higher health risks or disparities.
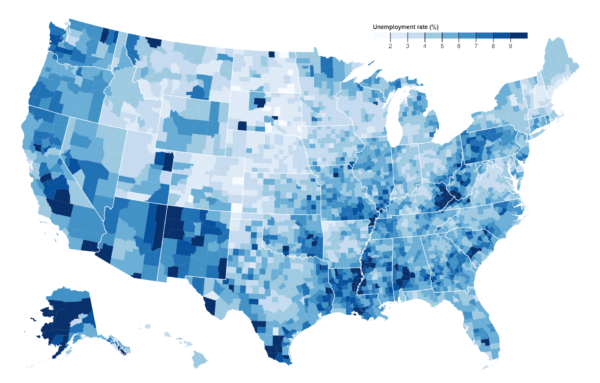
Economic Indicators: They are used to represent economic data such as GDP per capita, unemployment rates, poverty levels, etc. This aids in identifying regions with economic prosperity or challenges.
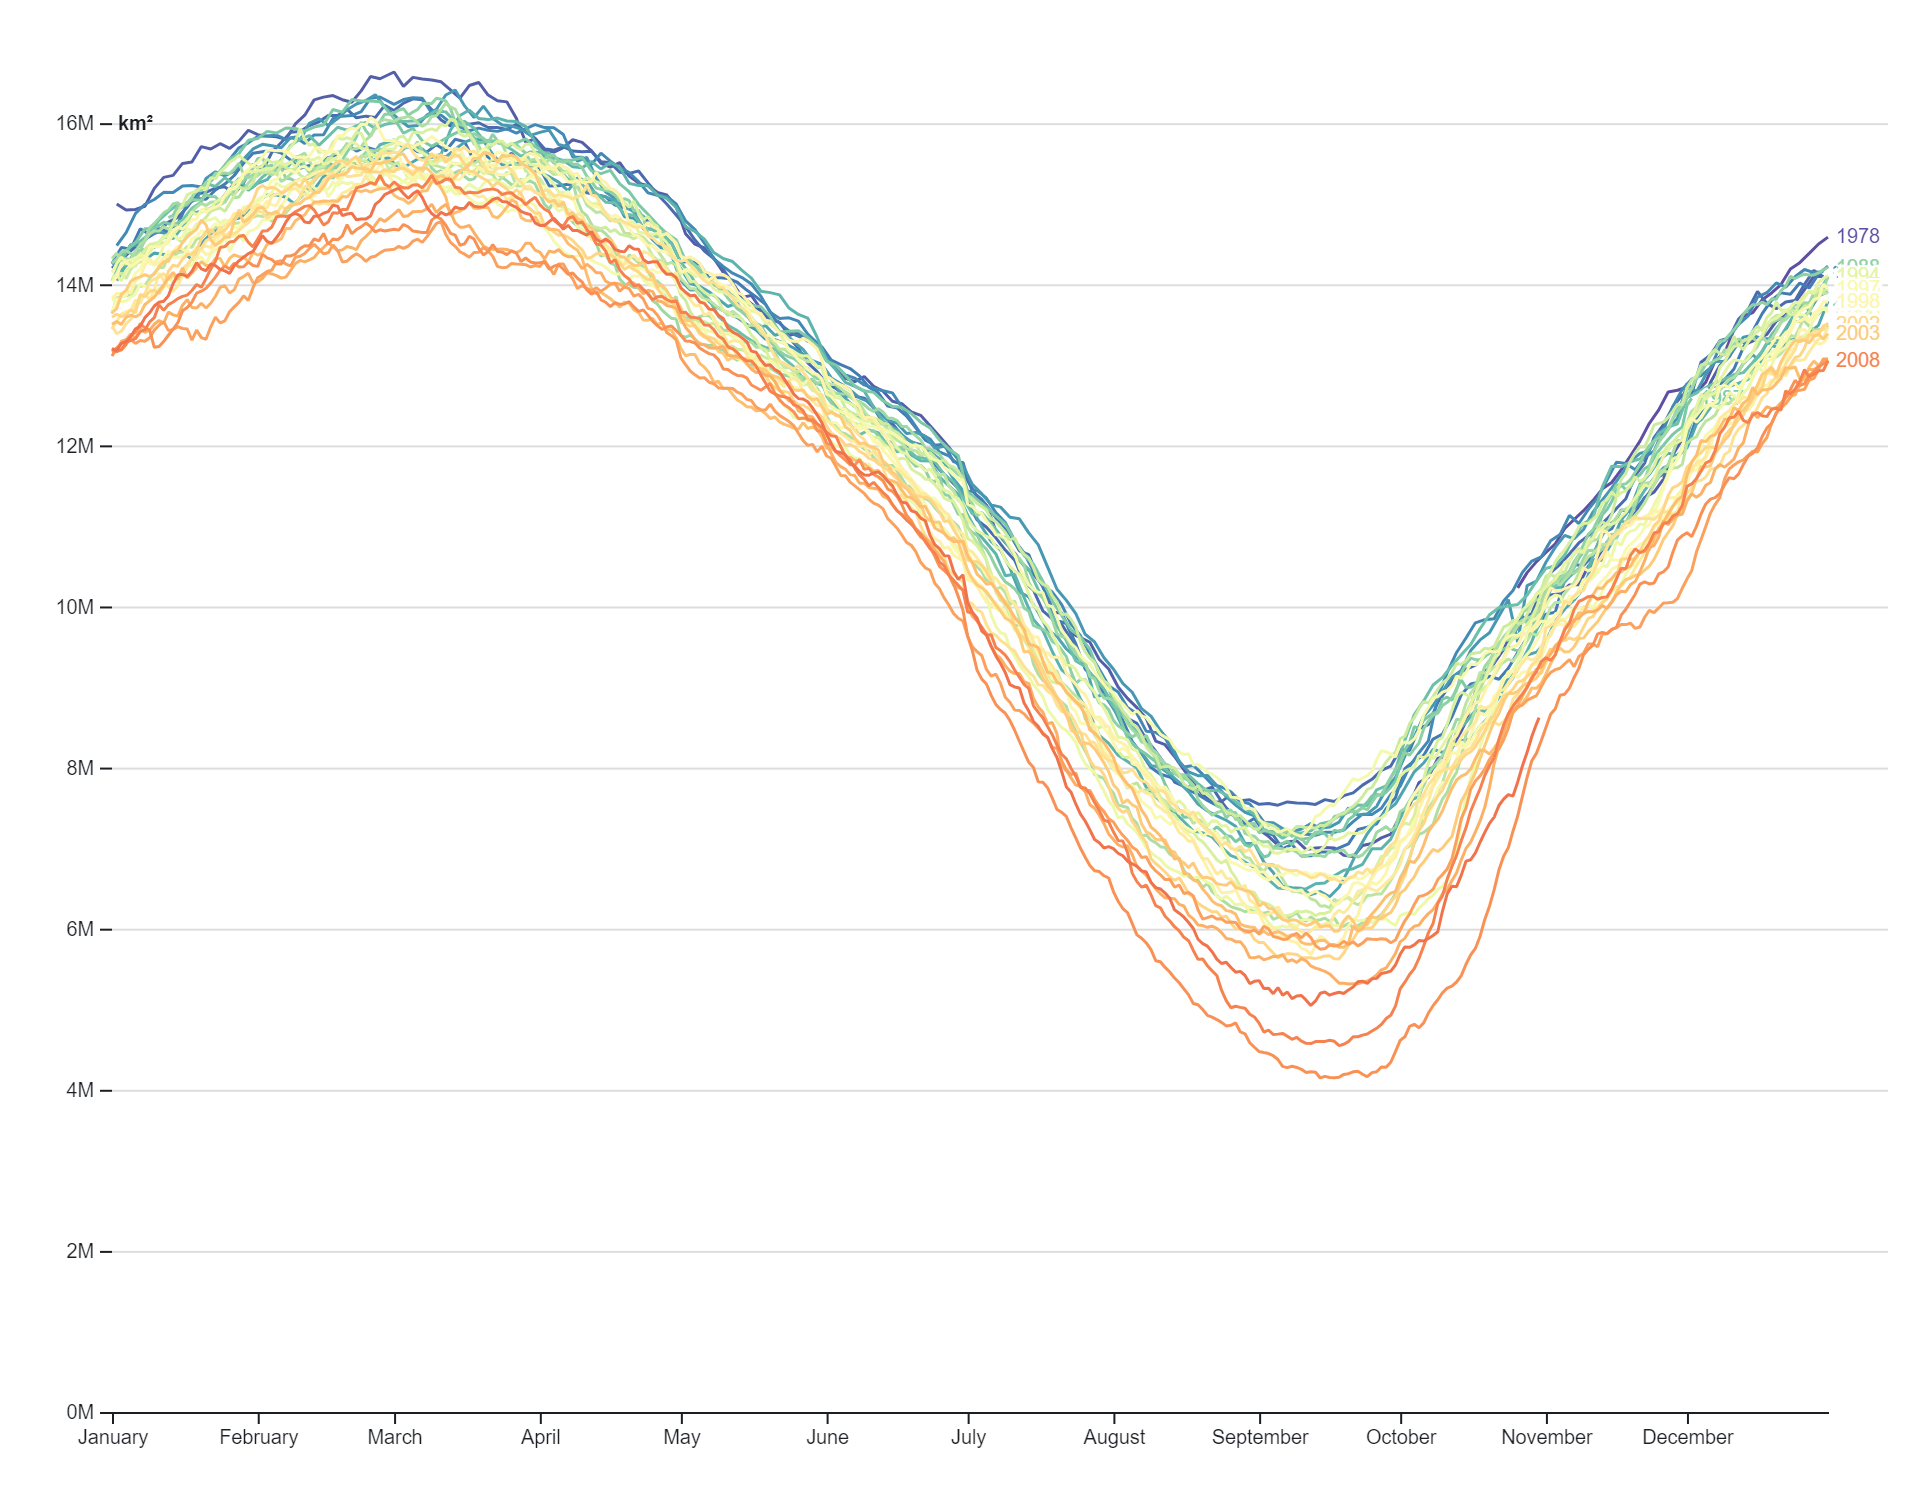
Environmental Studies: Choropleth maps are utilized in environmental studies to show data related to pollution levels, deforestation rates, biodiversity hotspots, climate change impacts, etc. This helps in understanding environmental trends and patterns.
Urban Planning: Urban planners use choropleth maps to visualize data related to infrastructure, land use, transportation networks, crime rates, and other factors influencing urban development.
Education: Choropleth maps can display educational data such as literacy rates, school enrollment rates, academic achievement levels, etc. This assists in identifying areas with educational needs or successes.
Market Analysis: They are used in market analysis to visualize consumer behavior, market penetration, sales data, and other market-related metrics across different regions.
Natural Disasters: Choropleth maps can show data related to natural disasters such as earthquake risk, flood susceptibility, wildfire frequency, etc. This aids in disaster preparedness and response planning.
Tourism: In the tourism industry, choropleth maps can represent tourist arrivals, accommodation occupancy rates, popular tourist destinations, etc. This helps in tourism planning and marketing strategies
Purpose of choropleth :
The purpose of choropleth maps is to visually represent spatial data by coloring or shading geographic regions (such as countries, states, or administrative districts) according to the value of a particular variable within each region. These maps serve several important purposes:
Data Visualization: Choropleth maps provide a clear and intuitive way to visualize data patterns and distributions across different geographical areas. By assigning colors or shades to represent different values of a variable, they make it easy to identify spatial trends and disparities.
Comparison: Choropleth maps allow for easy comparison of data across regions. By visually contrasting the colors or shades of different areas, viewers can quickly discern variations in the variable being mapped.
Spatial Analysis: These maps facilitate spatial analysis by highlighting spatial relationships and patterns in the data. They help researchers and analysts identify clusters, hotspots, outliers, and other spatial phenomena that may not be evident from tabular data alone.
Communication: Choropleth maps are effective tools for communicating information to a wide audience, including policymakers, stakeholders, and the general public. They convey complex spatial data in a visually appealing and easily understandable format, making them useful for presentations, reports, and educational materials.
Decision Making: Choropleth maps aid decision-making processes by providing policymakers and planners with spatially explicit information. By visualizing data on factors such as demographics, economics, health, and environment, these maps help inform decisions related to resource allocation, policy formulation, and strategic planning.
Exploration and Discovery: Choropleth maps can also be used for exploration and discovery, allowing users to uncover new insights and patterns in the data. By interacting with the map and adjusting parameters, users can explore different aspects of the data and uncover hidden relationship
Reviews
There are no reviews yet.
Only logged in customers who have purchased this product may leave a review.

Reviews
There are no reviews yet.