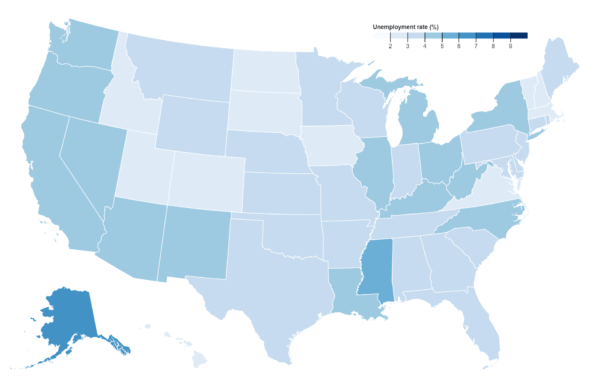
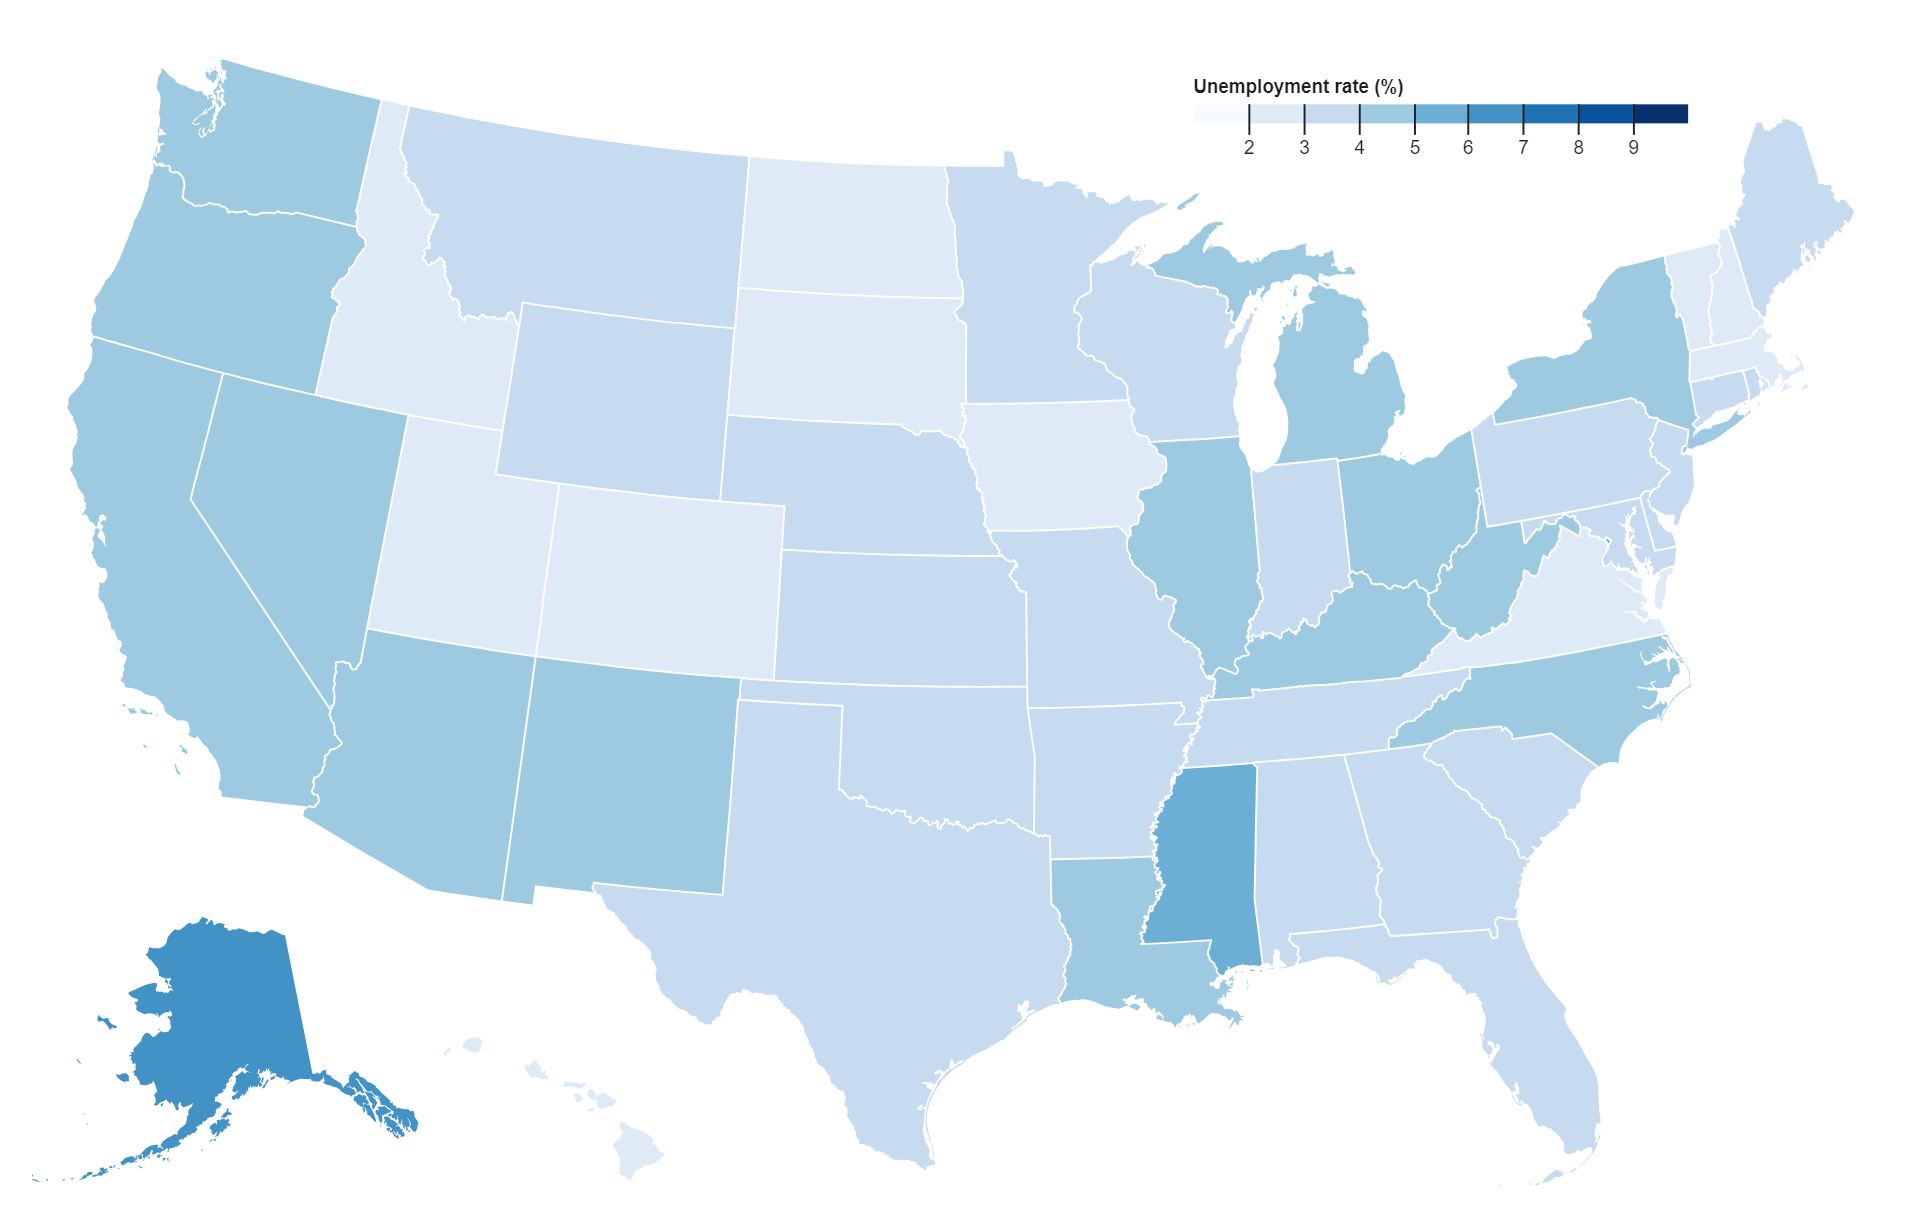
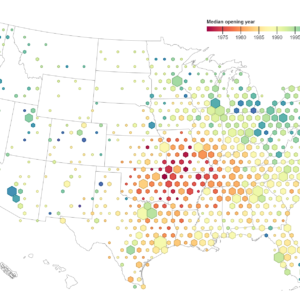
A state choropleth map is a type of thematic map that visually represents statistical data at the state level. Each state is depicted as a distinct polygon, with its color or shading determined by the value of a particular variable being mapped. Darker or more intense colors typically represent higher values of the variable, while lighter colors represent lower values. State choropleth maps are commonly used to visualize a wide range of data, including population density, income levels, educational attainment, and electoral outcomes. They provide a clear and intuitive way to identify spatial patterns and disparities across different states within a country, making them valuable tools for analysis, decision-making, and communication of geographic information.
Purposes of US State choropleth map:
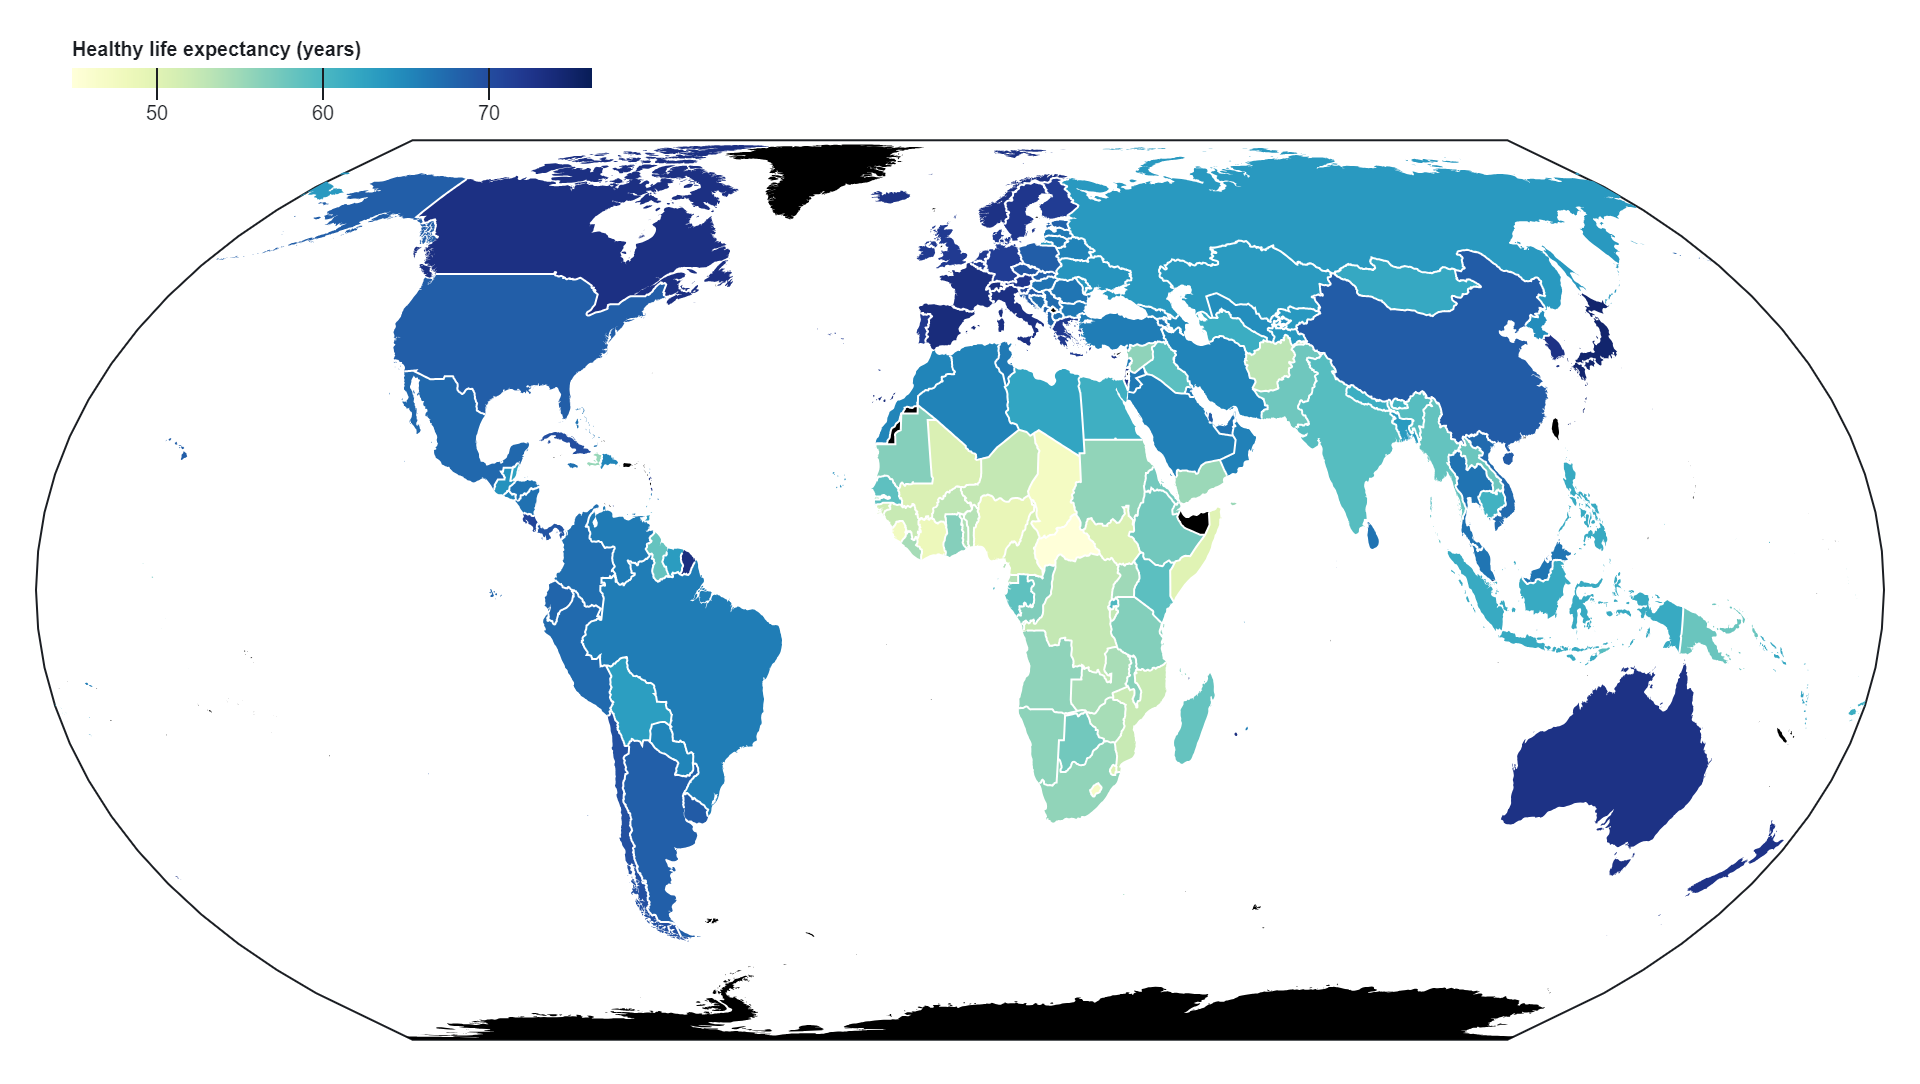
Visualizing Geographic Patterns: Choropleth maps allow viewers to see how a particular variable, such as population density, income levels, or political affiliations, are distributed across different regions of the United States. This visualization helps identify spatial patterns and trends.
Understanding Demographic and Socioeconomic Characteristics: Choropleth maps can be used to represent demographic or socioeconomic data, providing insights into factors such as population distribution, income inequality, educational attainment, or employment rates across states or regions.
Highlighting Disparities and Inequalities: By visually representing data on a map, choropleth maps can highlight disparities and inequalities between different states or regions. This can be useful for identifying areas with higher levels of poverty, lower access to healthcare or education, or other social and economic challenges.
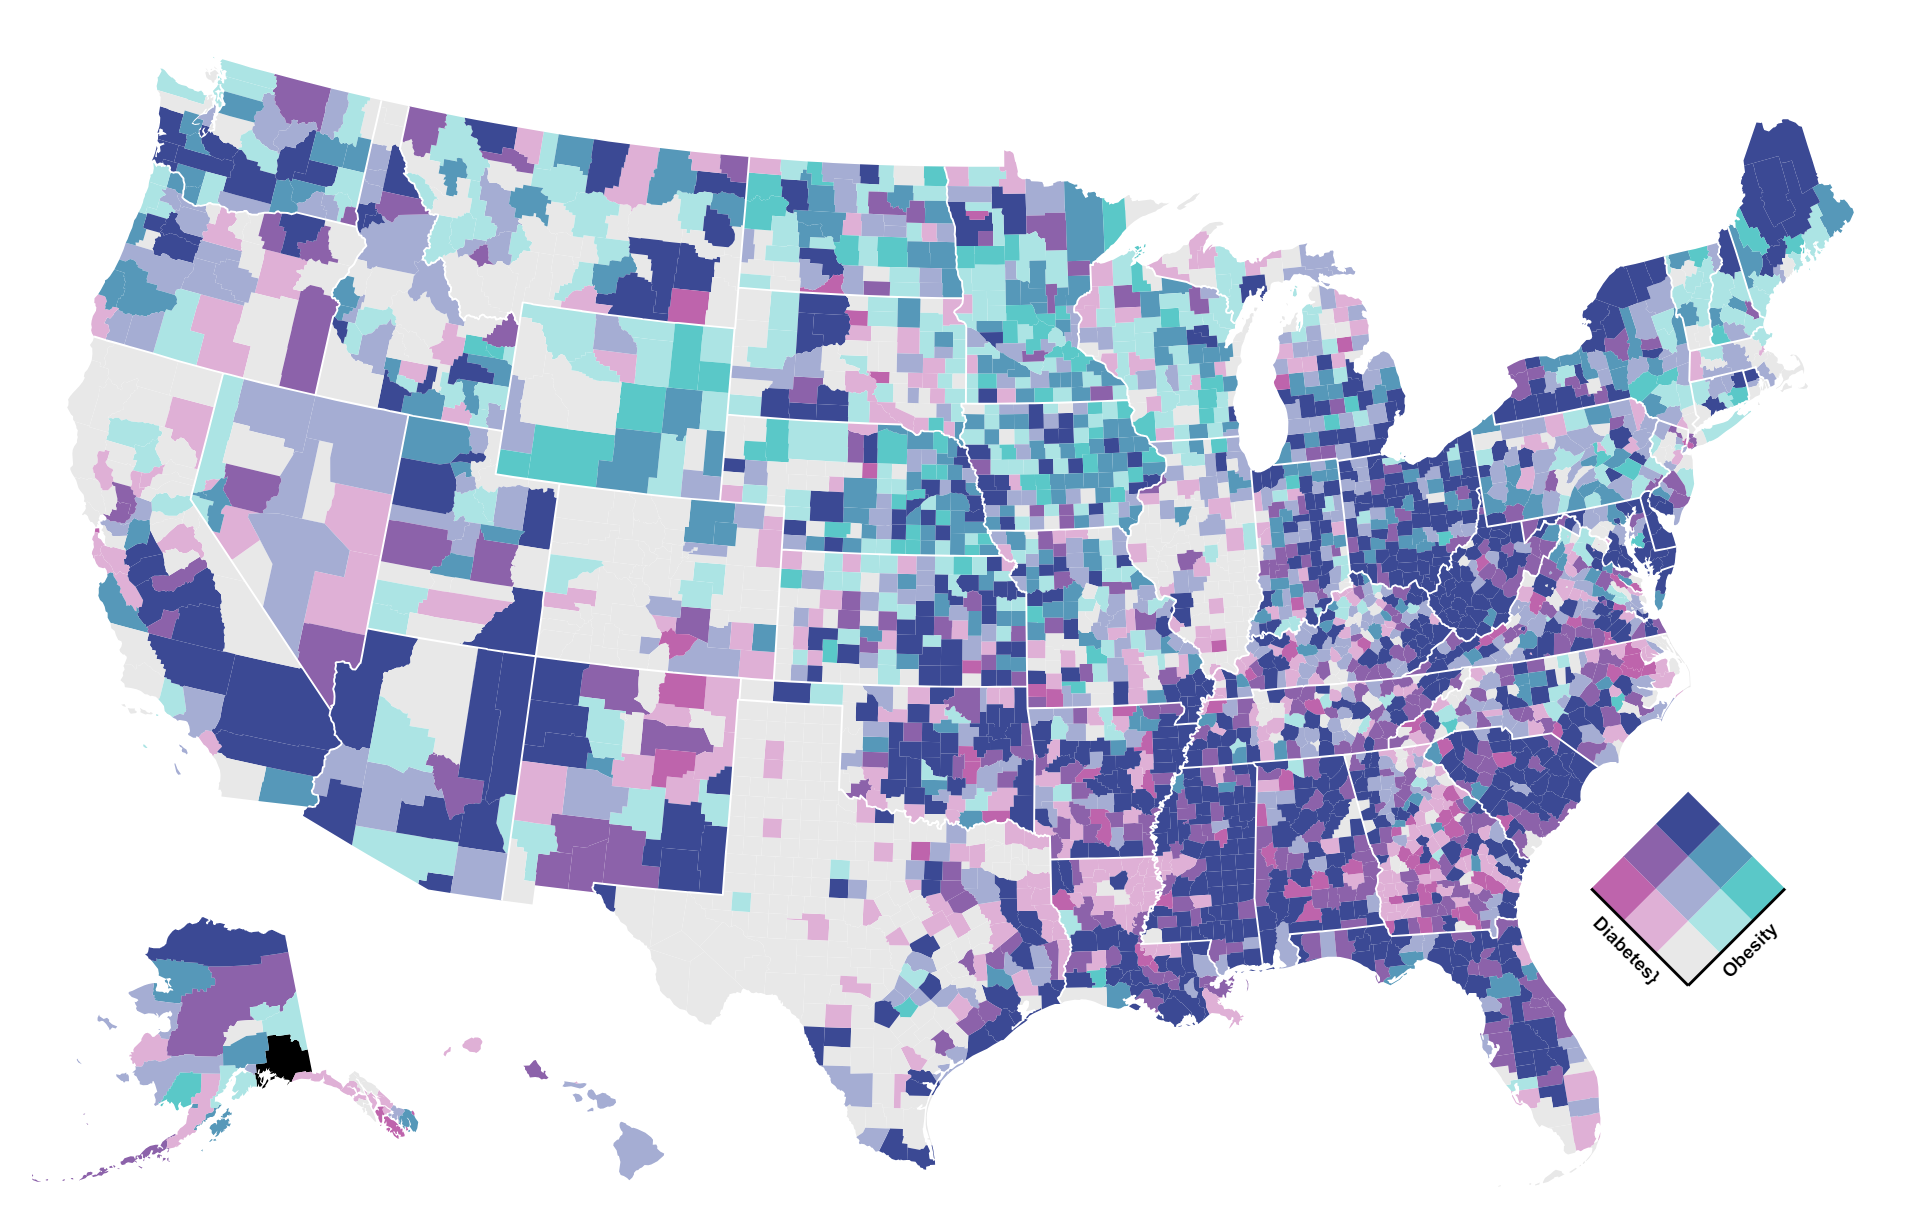
Supporting Policy and Decision Making: Policymakers and researchers use choropleth maps to inform policy decisions and resource allocation strategies. For example, maps showing areas with high rates of a certain disease might inform public health initiatives, while maps of economic indicators might guide investment decisions.
Analyzing Political Geography: Choropleth maps are commonly used in political analysis to visualize voting patterns, party affiliations, and electoral outcomes. These maps can help identify “red” (Republican) and “blue” (Democratic) states, swing states, and other political trends.
Communicating Information Effectively: Choropleth maps are a powerful tool for communicating complex information in a clear and intuitive way. By representing data visually on a map, they make it easier for viewers to understand spatial relationships and trends compared to traditional tables or charts.
Uses of choropleth map
Demographic Analysis: Choropleth maps can represent demographic data such as population density, age distribution, racial composition, or household income. These maps help researchers, policymakers, and businesses understand the demographic makeup of different regions within the United States.
Socioeconomic Analysis: By mapping socioeconomic indicators like poverty rates, educational attainment, unemployment rates, or median household income, choropleth maps can highlight disparities and inequalities across states or regions. This information is valuable for social scientists, economists, and policymakers working to address social and economic challenges.
Healthcare Planning: Choropleth maps can display health-related data such as rates of disease prevalence, access to healthcare facilities, or vaccination coverage. Healthcare providers, public health officials, and policymakers use these maps to identify areas with health disparities and target resources for prevention and intervention efforts.
Political Analysis: Choropleth maps are commonly used in political analysis to visualize voting patterns, party affiliations, and electoral outcomes. These maps help political analysts, campaign strategists, and policymakers understand the political geography of the United States and identify key battlegrounds in elections.
Environmental Assessment: Choropleth maps can represent environmental data such as air quality, water pollution levels, or natural disaster risks. Environmental scientists, policymakers, and advocacy groups use these maps to assess environmental health, identify areas of concern, and prioritize conservation or remediation efforts.
Market Research: Businesses use choropleth maps to analyze market demographics, consumer behavior, and demand patterns across different regions of the United States. These maps help businesses identify target markets, plan marketing strategies, and allocate resources effectively.
Education and Research: Choropleth maps are valuable tools for educators and researchers studying geography, sociology, economics, public health, and other disciplines. These maps facilitate spatial analysis, hypothesis testing, and data visualization, enhancing understanding and insight into various phenomena.
Communicating Information: Choropleth maps provide a clear and intuitive way to communicate complex data to a wide audience. Journalists, educators, advocacy groups, and government agencies use these maps to inform the public, raise awareness about important issues, and support evidence-based decision-making.
Overall, choropleth maps of the United States serve a wide range of uses across different sectors, helping to visualize, analyze, and communicate information about demographics, socioeconomic conditions, health, politics, environment, markets, and more.
Reviews
There are no reviews yet.
Only logged in customers who have purchased this product may leave a review.
Reviews
There are no reviews yet.