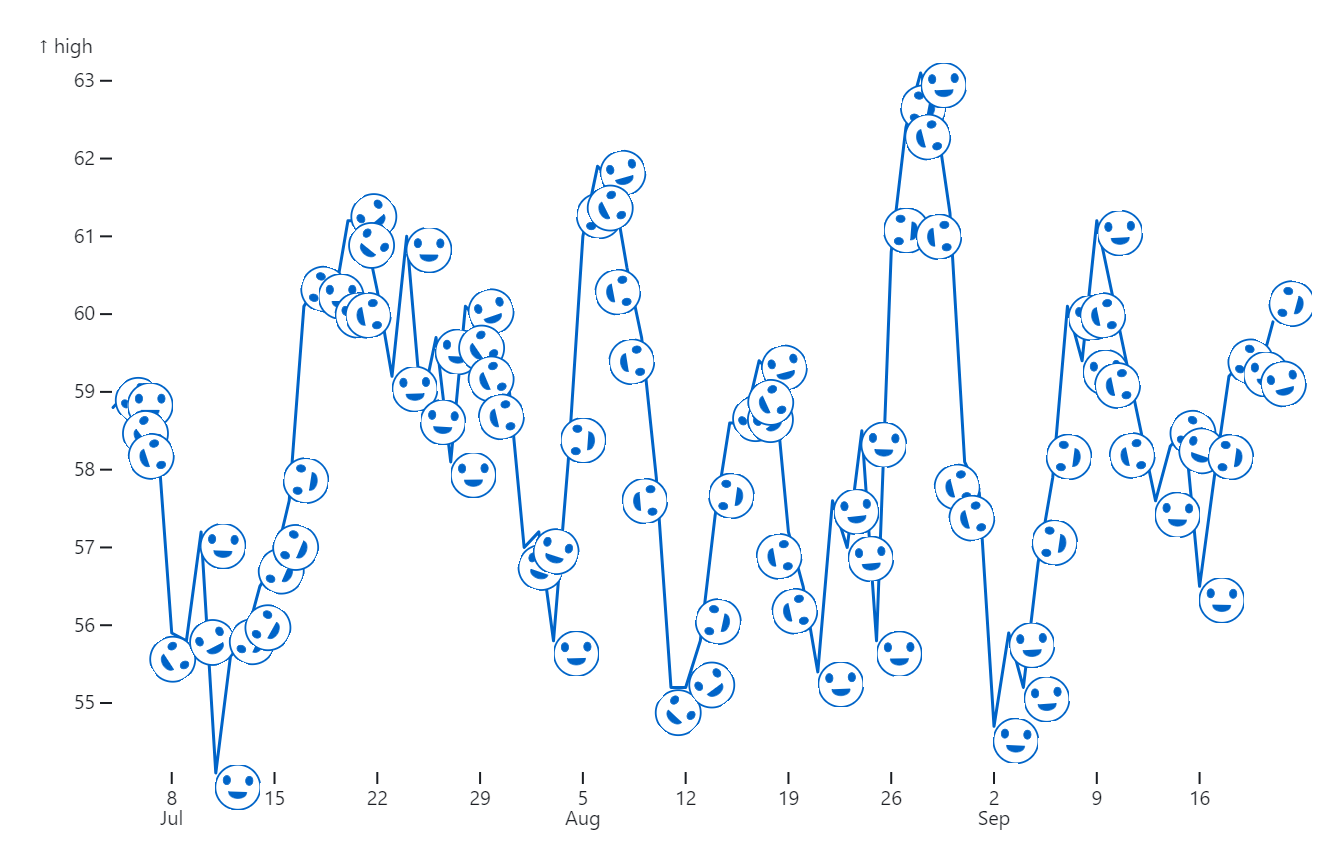
A Timeline with Observable Plot is a dynamic visualization tool that combines a timeline view with an observable plot to represent data over time. This visualization typically displays data points or events along a chronological timeline, allowing users to visualize how variables change or evolve over time. The observable plot component provides additional context or detail, such as numerical values or trends associated with each data point. Together, these features offer a comprehensive view of temporal data, enabling users to analyze trends, patterns, and relationships over time.
Uses:
Project Management: Project managers use timeline with observable plot visualizations to track project milestones, deadlines, and progress over time, facilitating project planning and monitoring.
Historical Analysis: Historians and researchers use timeline with observable plot visualizations to analyze historical events, trends, and developments, gaining insights into historical patterns and trajectories.
Financial Analysis: Financial analysts use timeline with observable plot visualizations to analyze financial data, track market trends, and visualize investment performance over time.
Healthcare Analytics: Healthcare professionals use timeline with observable plot visualizations to track patient data, monitor disease progression, and analyze healthcare outcomes over time.
Environmental Monitoring: Environmental scientists use timeline with observable plot visualizations to monitor environmental data, track changes in environmental indicators, and analyze long-term environmental trends.
Educational Visualization: Educators use timeline with observable plot visualizations to create interactive educational materials, visualizing historical events, scientific phenomena, or literary timelines.
Social Media Analytics: Social media analysts use timeline with observable plot visualizations to track social media trends, analyze user engagement, and visualize content performance over time.
Supply Chain Management: Supply chain managers use timeline with observable plot visualizations to track inventory levels, monitor production schedules, and visualize supply chain performance over time.
Sales and Marketing Analytics: Sales and marketing professionals use timeline with observable plot visualizations to track sales trends, analyze marketing campaigns, and visualize customer behavior over time.
Urban Planning: Urban planners use timeline with observable plot visualizations to track urban development projects, monitor infrastructure changes, and visualize demographic trends over time.
Purposes:
Temporal Analysis: The visualization facilitates temporal analysis by representing data points or events along a chronological timeline, enabling users to identify patterns, trends, and temporal relationships.
Comparative Analysis: Users can compare multiple data series or variables over time using the observable plot component, allowing for comparative analysis and trend identification.
Forecasting: The visualization supports forecasting and trend prediction by visualizing historical data trends and extrapolating future projections based on observed patterns.
Data Exploration: Users can explore temporal data in detail using interactive features such as zooming, filtering, and highlighting, enabling deeper insights into temporal patterns and anomalies.
Communication: Timeline with observable plot visualizations serves as a communication tool for presenting complex temporal data in a clear, intuitive manner, facilitating data-driven decision-making and collaboration.
Pattern Recognition: Users can identify recurring patterns, cycles, or irregularities in temporal data using visual cues provided by the timeline with observable plot visualization.
Event Tracking: The visualization helps users track events, milestones, or critical incidents over time, providing context and understanding of how events unfold and their impact on related variables.
Performance Monitoring: Users can monitor performance metrics, KPIs, or key indicators over time using the timeline with observable plot visualization, enabling continuous performance tracking and improvement.
Strategic Planning: Organizations use the visualization for strategic planning by visualizing long-term trends, identifying emerging opportunities or threats, and informing strategic decision-making.
Data-driven Insights: The visualization enables data-driven insights by presenting temporal data in a visually compelling format, helping users extract actionable insights and make informed decisions based on observed trends and patterns.
Reviews
There are no reviews yet.
Only logged in customers who have purchased this product may leave a review.
")
")
Reviews
There are no reviews yet.