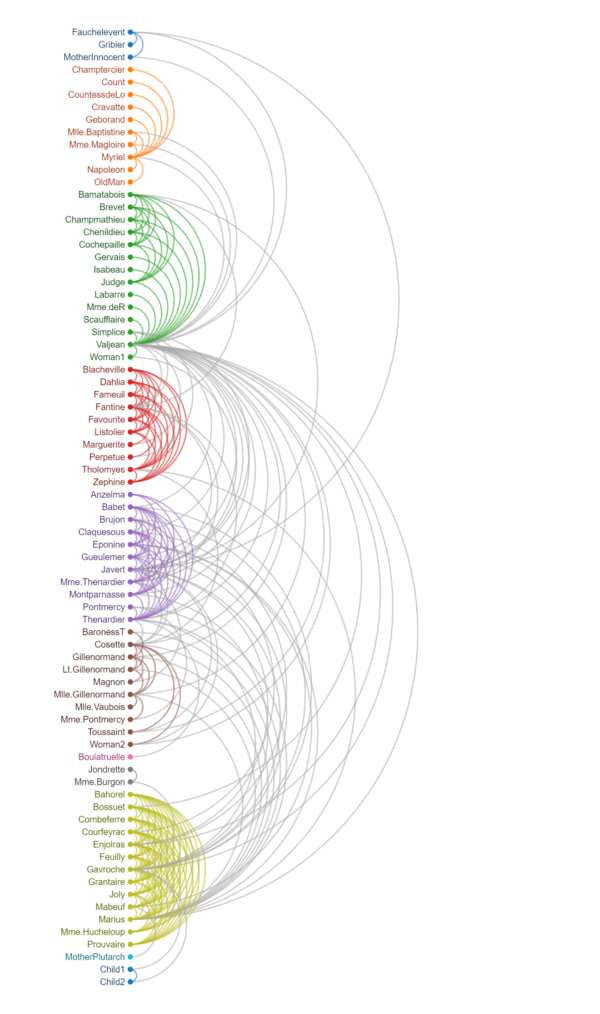
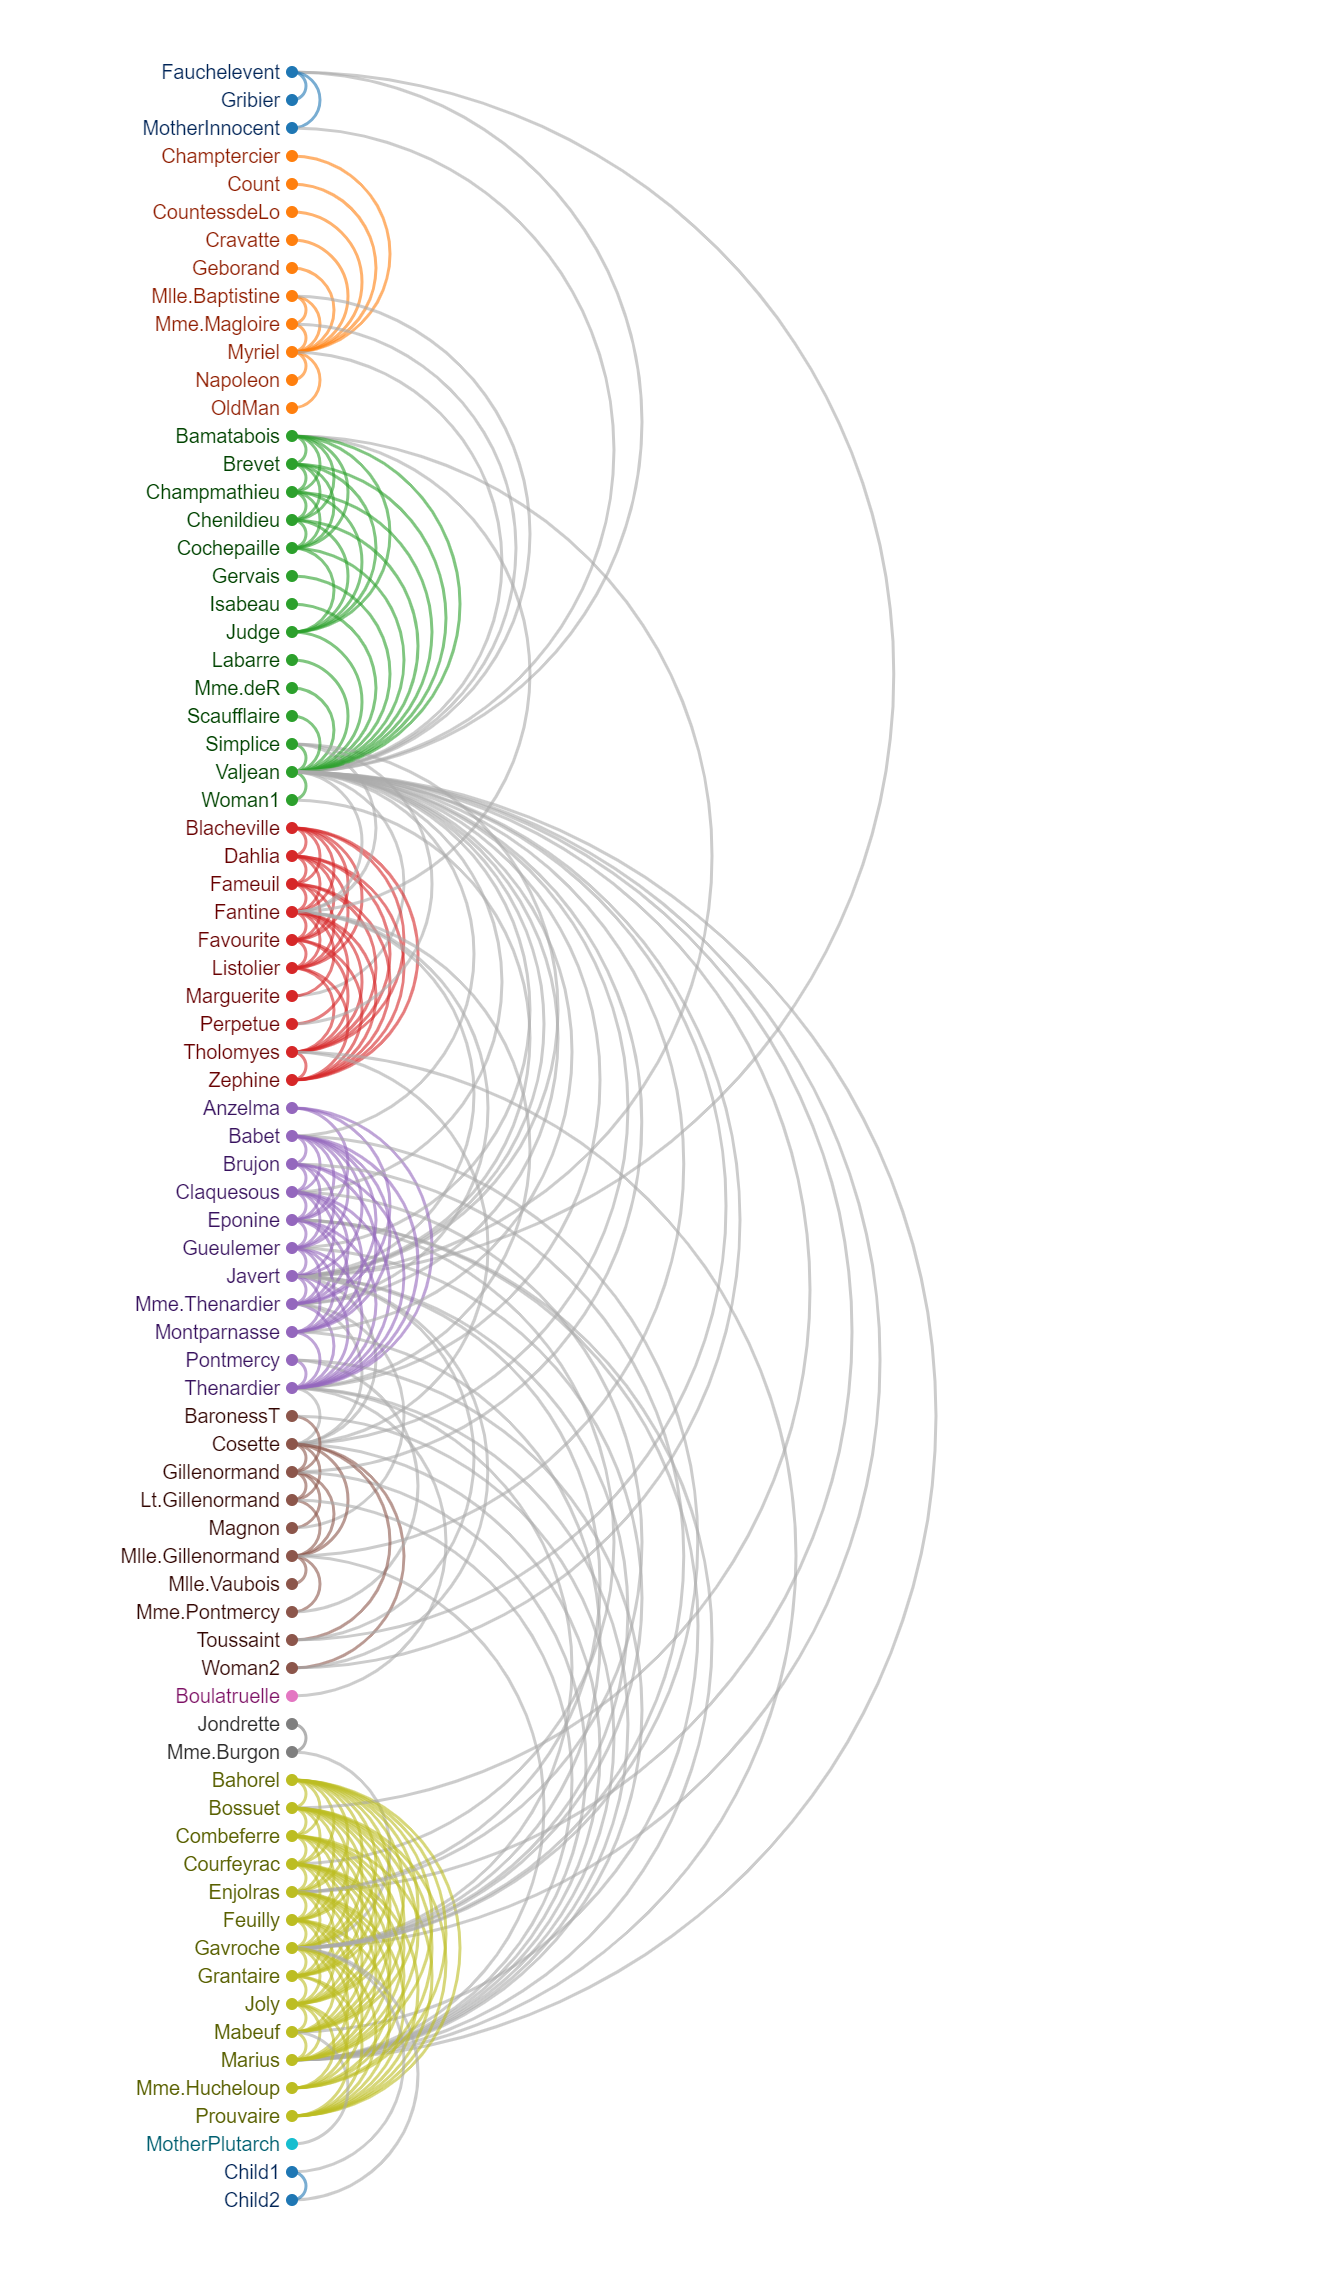
An arc diagram is a visual representation that displays relationships or connections between entities using arcs (curved lines) connecting them. It typically consists of nodes (representing entities) positioned along a single axis, with arcs connecting pairs of nodes to show relationships or interactions. Arc diagrams are commonly used in network analysis, data visualization, and graph theory to illustrate connections in a compact and intuitive manner.
Purposes :
The purpose of an arc diagram is to visually represent relationships or connections between entities in a network or dataset. This visualization technique serves several key purposes:
Identifying Relationships: Arc diagrams help users identify and understand relationships or connections between entities within a network or dataset. By visually displaying the links between nodes, patterns and trends in the data become more apparent.
Visualizing Network Structure: They provide a concise and intuitive representation of the structure of a network by illustrating how nodes are connected to each other through arcs. This aids in understanding the topology of the network and the flow of information or interactions.
Analyzing Connectivity: Arc diagrams facilitate the analysis of connectivity within a network, including the degree of connectivity of individual nodes, the presence of clusters or communities, and the overall density of connections.
Spotting Patterns and Anomalies: They help users identify patterns, trends, and anomalies in the data by visualizing the relationships between entities. This can lead to insights into the underlying structure or dynamics of the network.
Comparing Networks: Arc diagrams can be used to compare different networks or datasets by visually juxtaposing their structures and connections. This allows for comparative analysis and identification of similarities or differences between networks.
Communicating Findings: Arc diagrams serve as effective communication tools for conveying complex network structures and relationships to a broad audience. They enable researchers, analysts, and stakeholders to communicate findings and insights in a clear and visually compelling manner.
Overall, the purpose of an arc diagram is to provide a visual representation of network relationships, aiding in analysis, interpretation, and communication of complex network data.
Uses :
Arc diagrams have several uses across various domains, including:
Network Analysis: Arc diagrams are commonly used in network analysis to visualize relationships between nodes in a network. They help in understanding the structure, connectivity, and patterns within complex networks such as social networks, biological networks, or transportation networks.
Data Visualization: Arc diagrams serve as effective tools for visualizing connections or interactions between entities in large datasets. They provide a clear and intuitive representation of relationships, making it easier to identify trends, clusters, or outliers in the data.
Graph Theory: In graph theory, arc diagrams are used to represent graphs or networks, where nodes are represented as points and arcs represent connections between nodes. They help in studying properties of graphs, such as connectivity, paths, and cycles.
Genomics and Bioinformatics: Arc diagrams are utilized to visualize genetic or biological data, such as gene regulatory networks, protein-protein interactions, or metabolic pathways. They aid researchers in understanding complex biological systems and identifying key interactions.
Visualization of Time-Series Data: Arc diagrams can be used to visualize temporal relationships or sequences in time-series data. They help in understanding the flow of events over time and identifying temporal patterns or dependencies.
Software Visualization: In software engineering, arc diagrams are employed to visualize dependencies between modules, classes, or functions in software systems. They assist in understanding the structure and complexity of software codebases.
Historical Analysis: Arc diagrams can be used to visualize historical relationships or connections between events, individuals, or entities over time. They help historians and researchers in analyzing historical networks and understanding historical dynamics.
Business and Marketing Analysis: Arc diagrams are utilized in business and marketing analysis to visualize relationships between entities such as customers, products, or market segments. They aid in understanding customer behavior, market trends, and sales patterns.
Overall, arc diagrams are versatile visualization tools used across various disciplines to analyze, interpret, and communicate complex networks and relationships.
Reviews
There are no reviews yet.
Only logged in customers who have purchased this product may leave a review.
Reviews
There are no reviews yet.