Sale!
Description
Description :
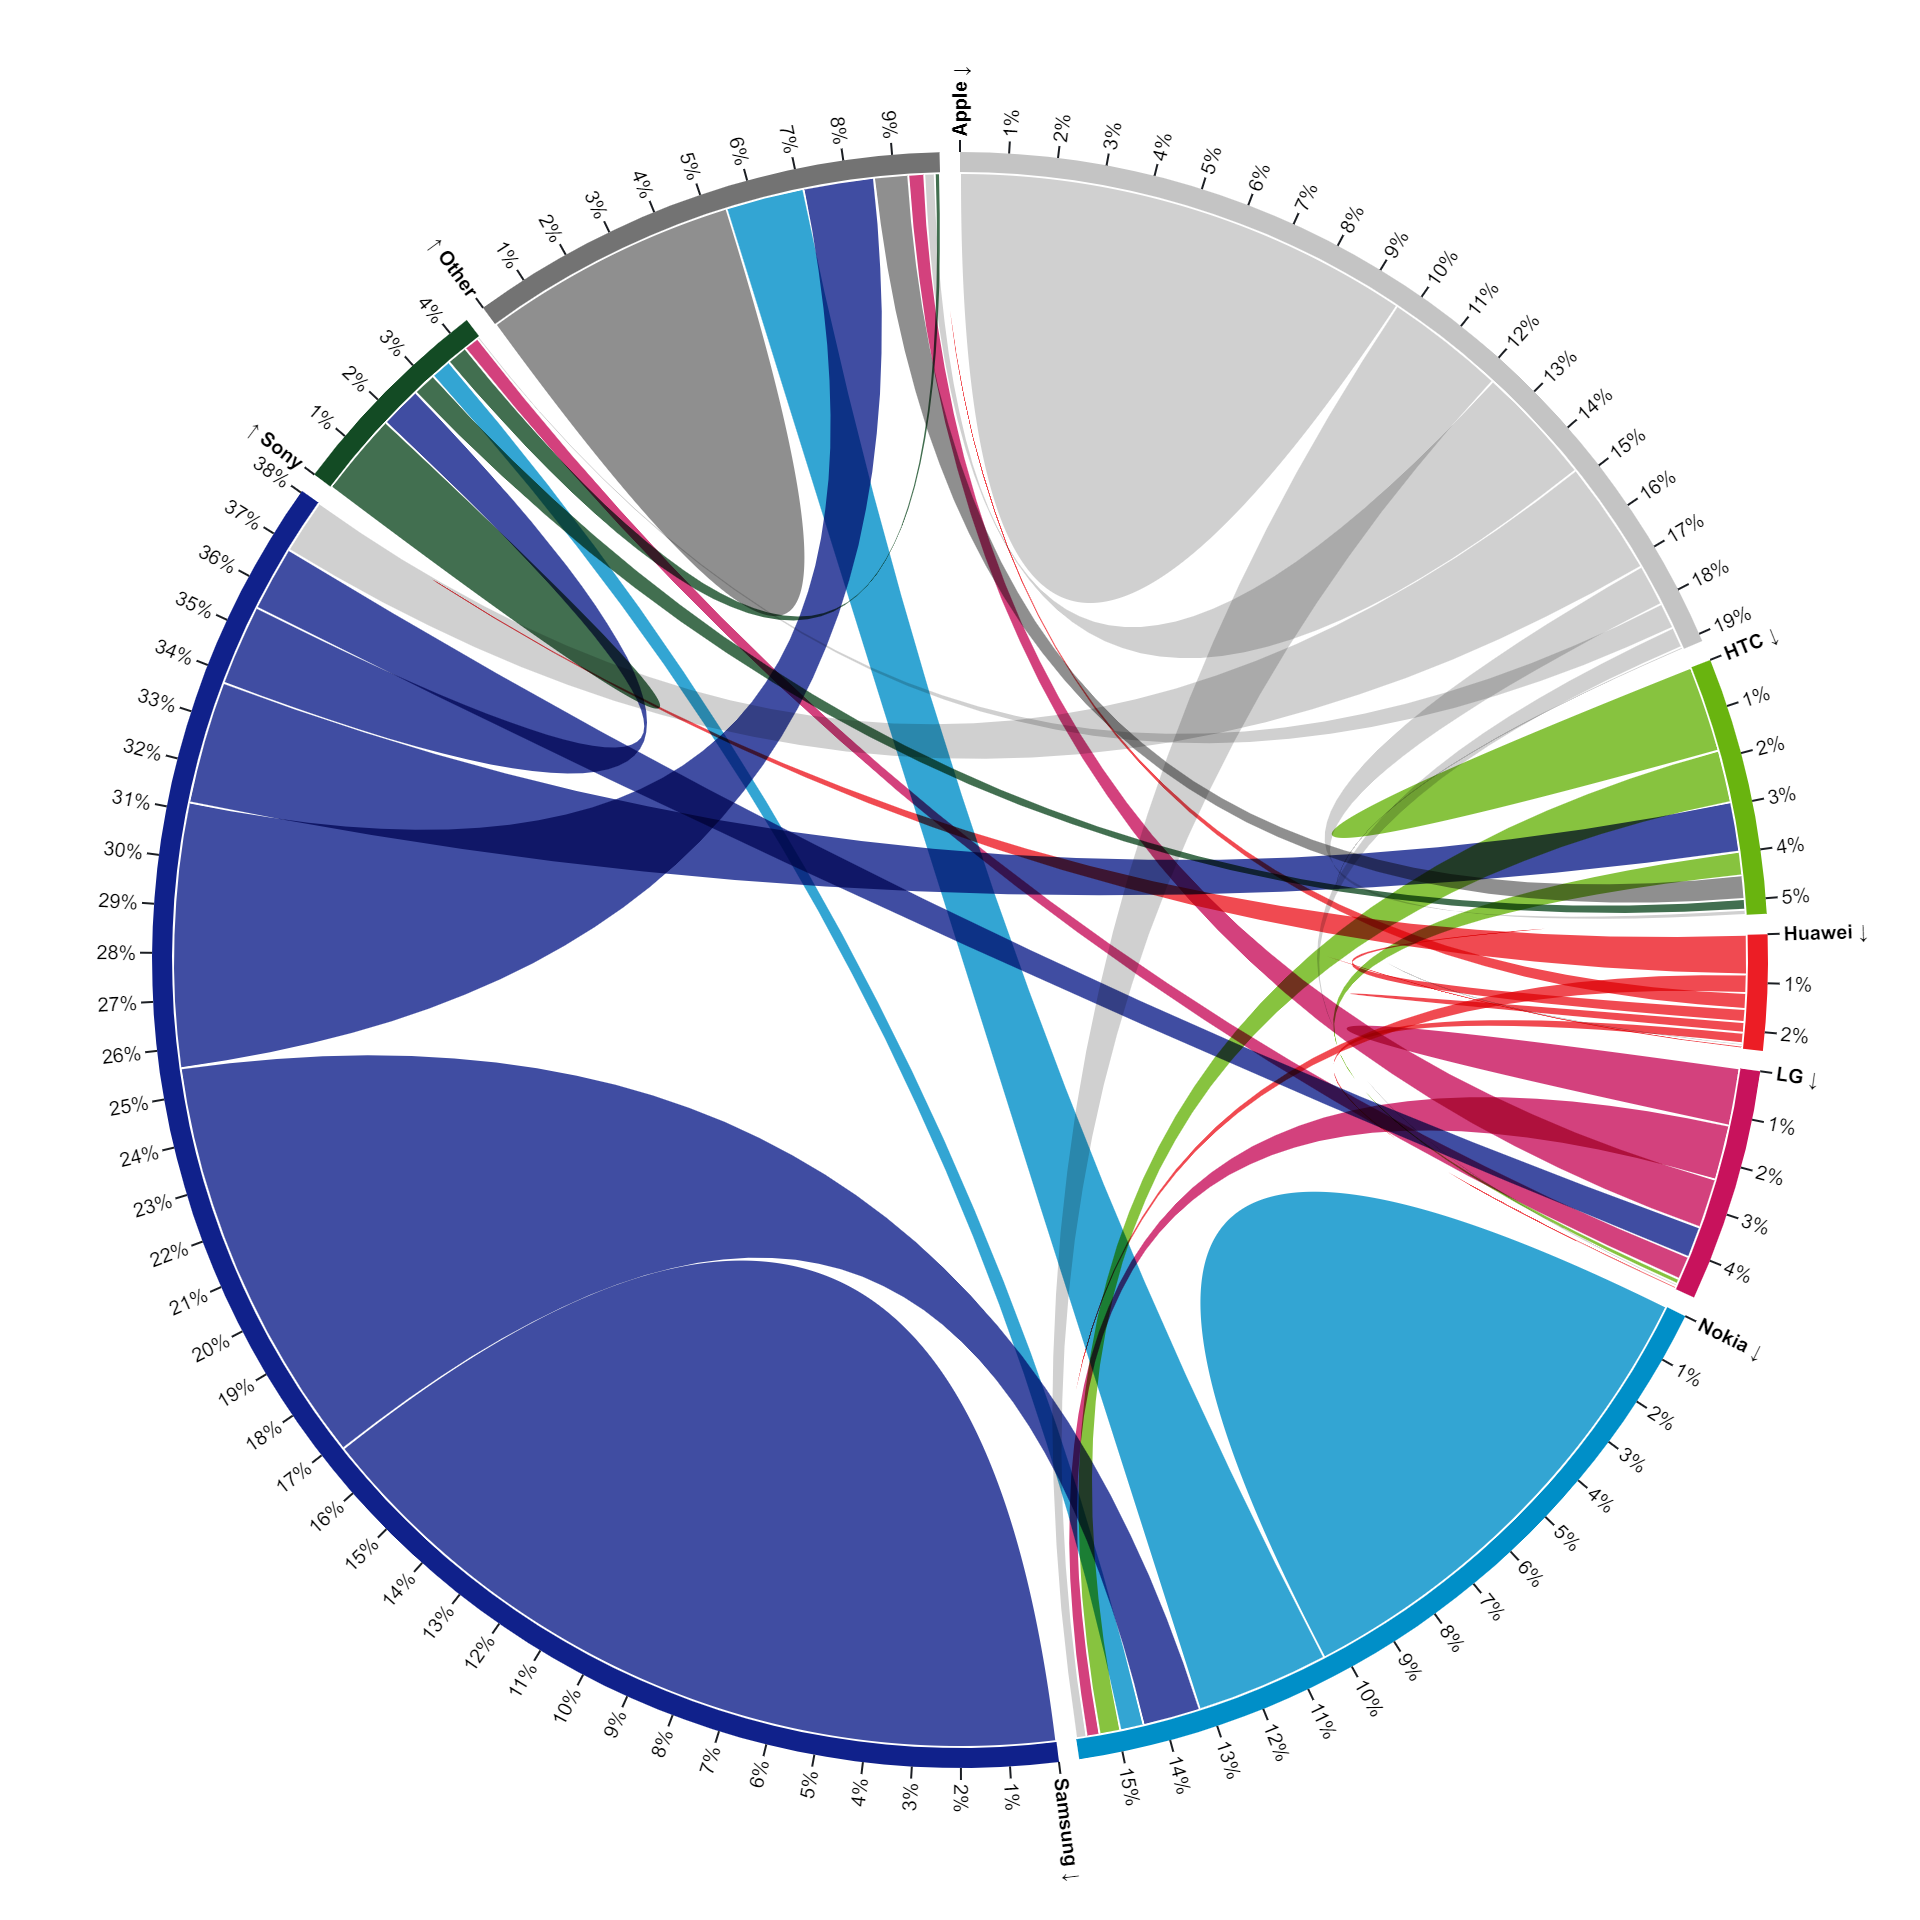
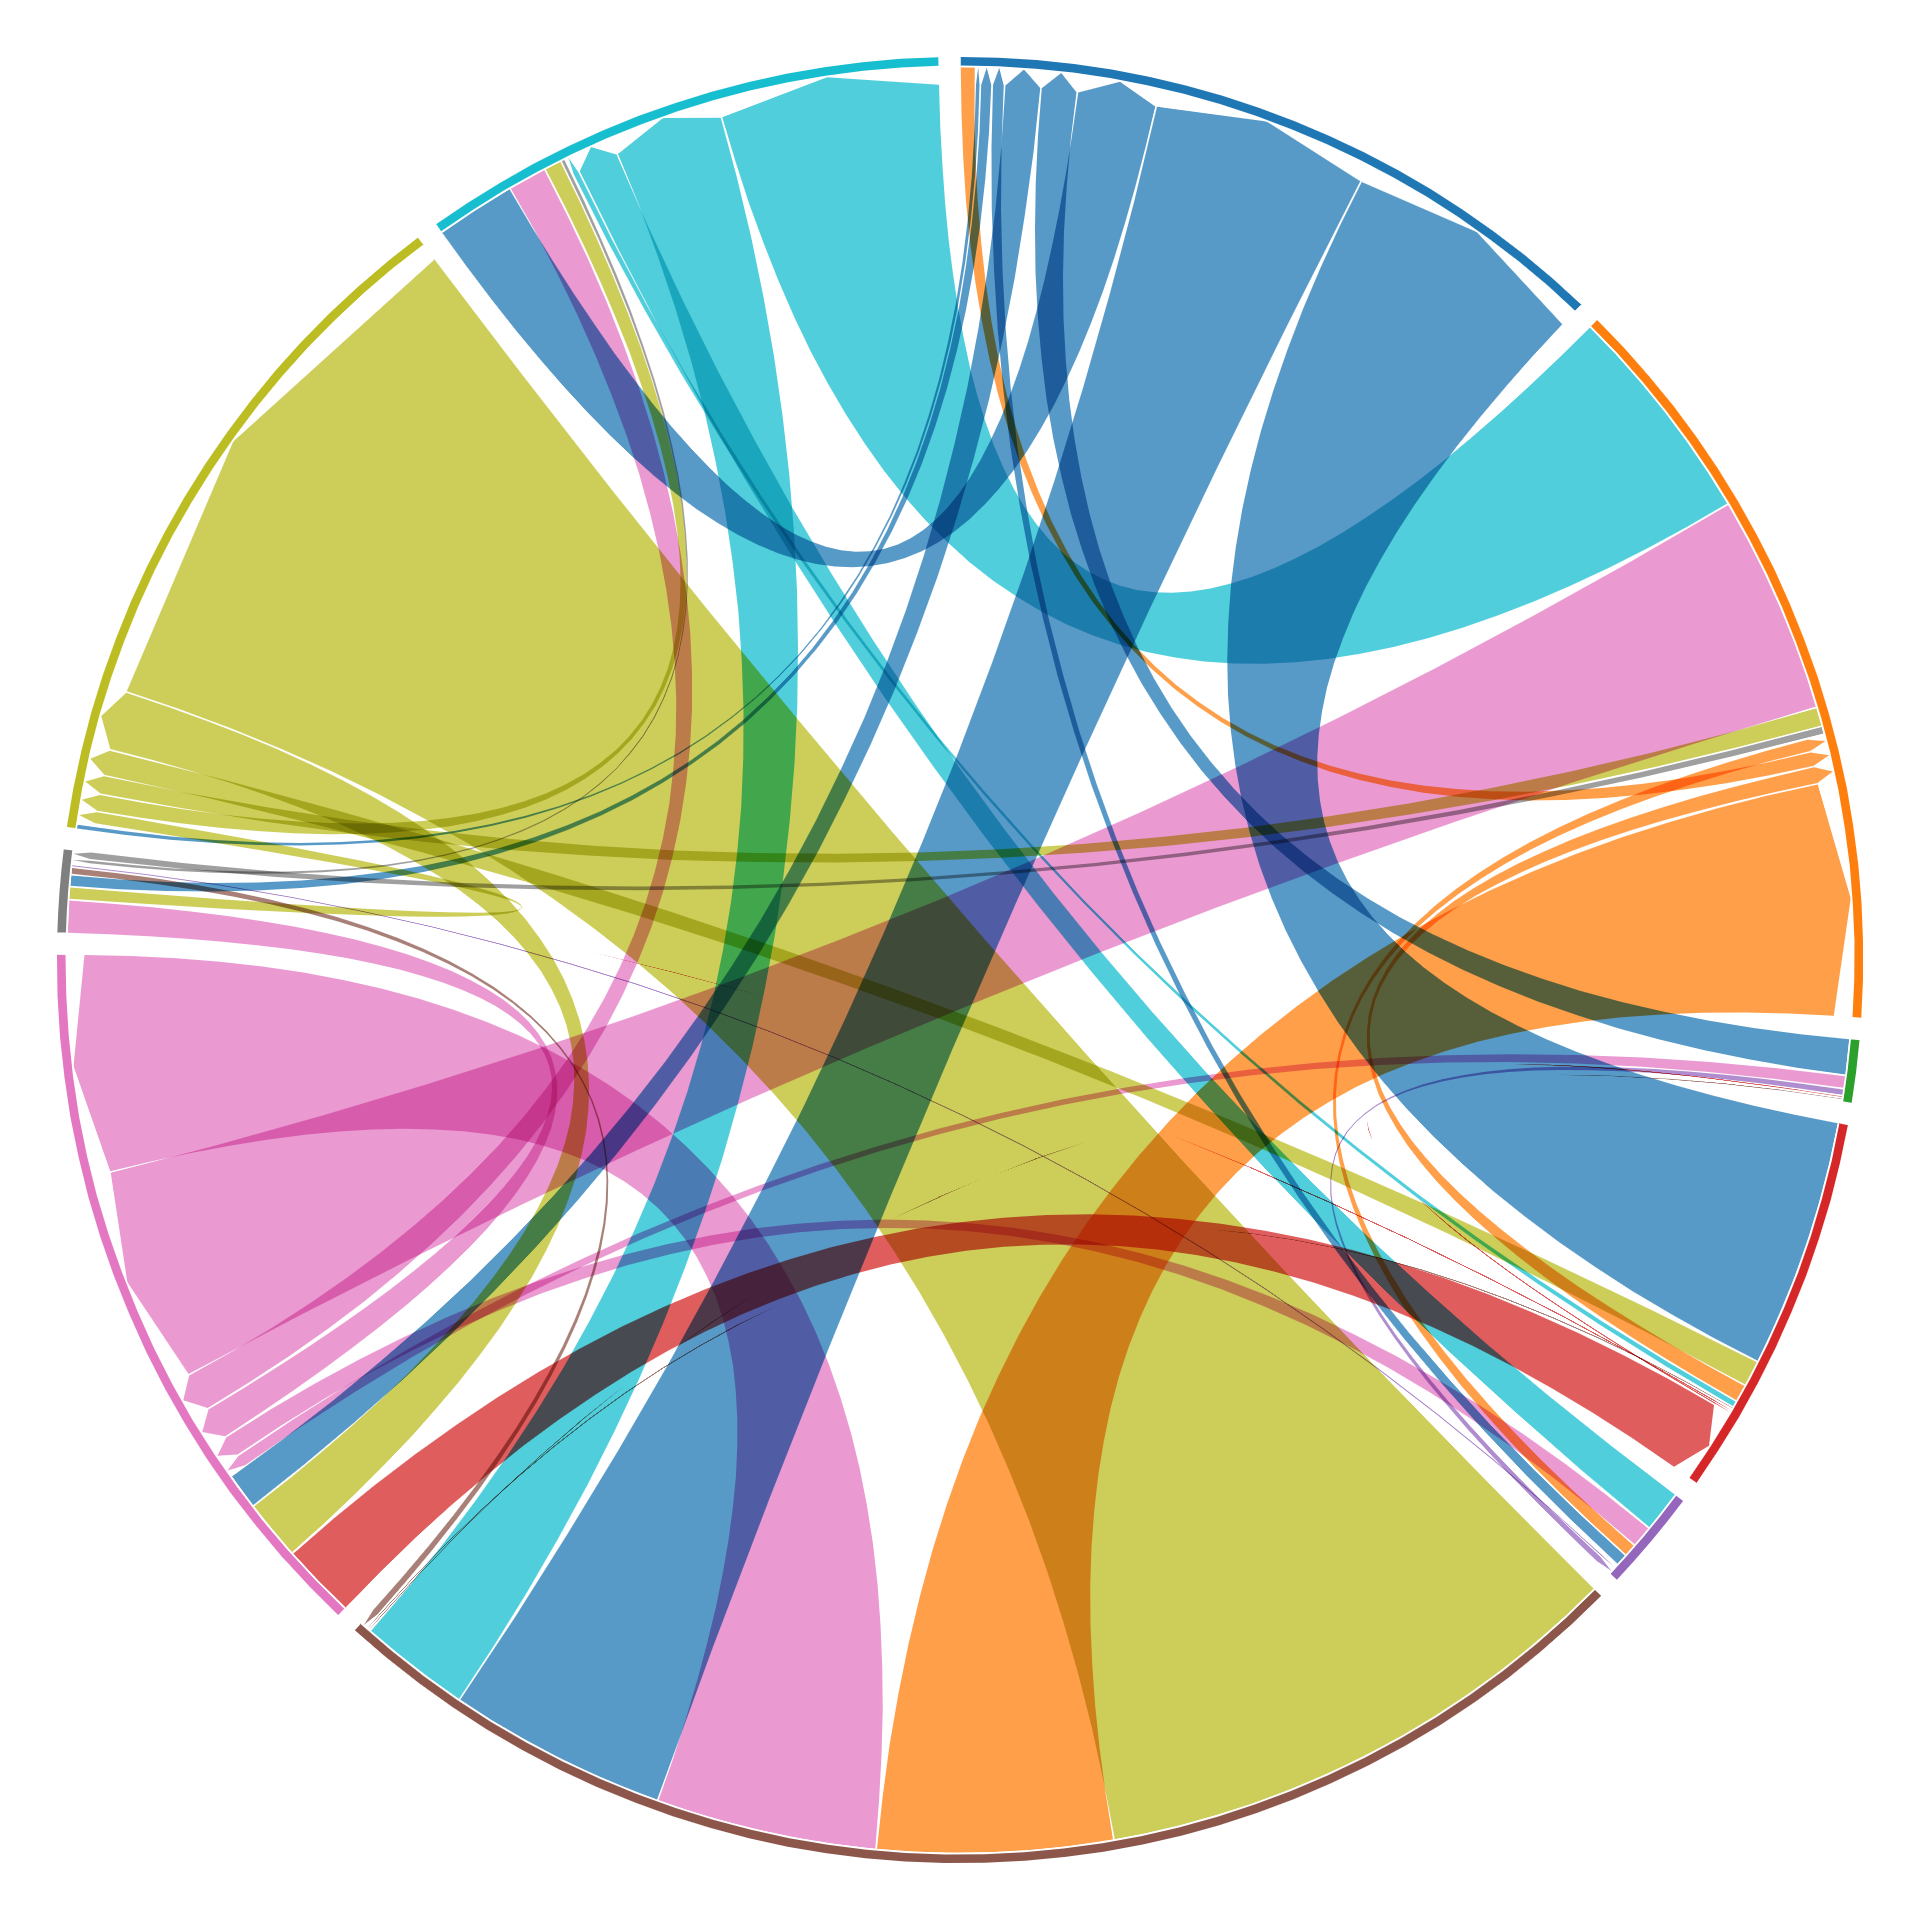
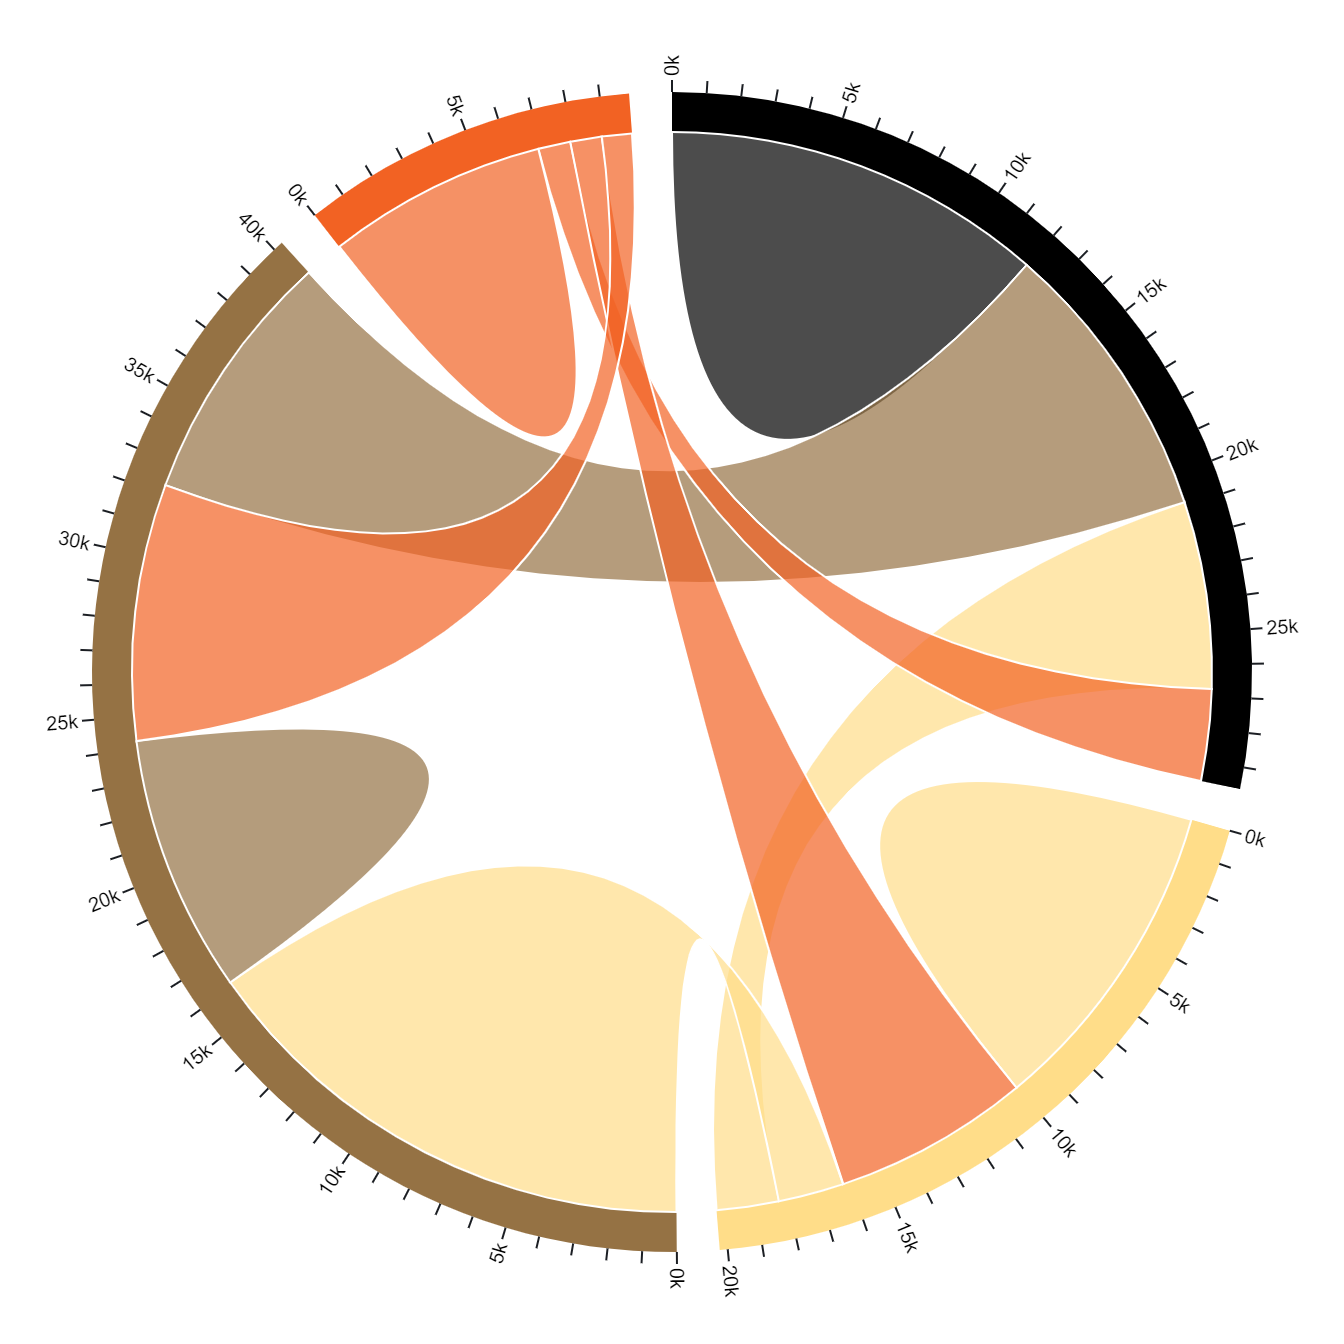
A chord diagram is a circular data visualization that displays relationships or connections between different entities or categories. It consists of a circle divided into segments, with each segment representing a category. Ribbons or chords connect pairs of segments, indicating connections or dependencies between categories. Chord diagrams are useful for visualizing complex networks, flow of information, or dependencies within a dataset. They provide a clear and intuitive way to understand relationships and patterns between entities.
Purpose :
Only logged in customers who have purchased this product may leave a review.

Reviews
There are no reviews yet.