Sale!

Directed Chord diagram

Original price was: $ 15.Current price is: $ 10.

Description

Description :

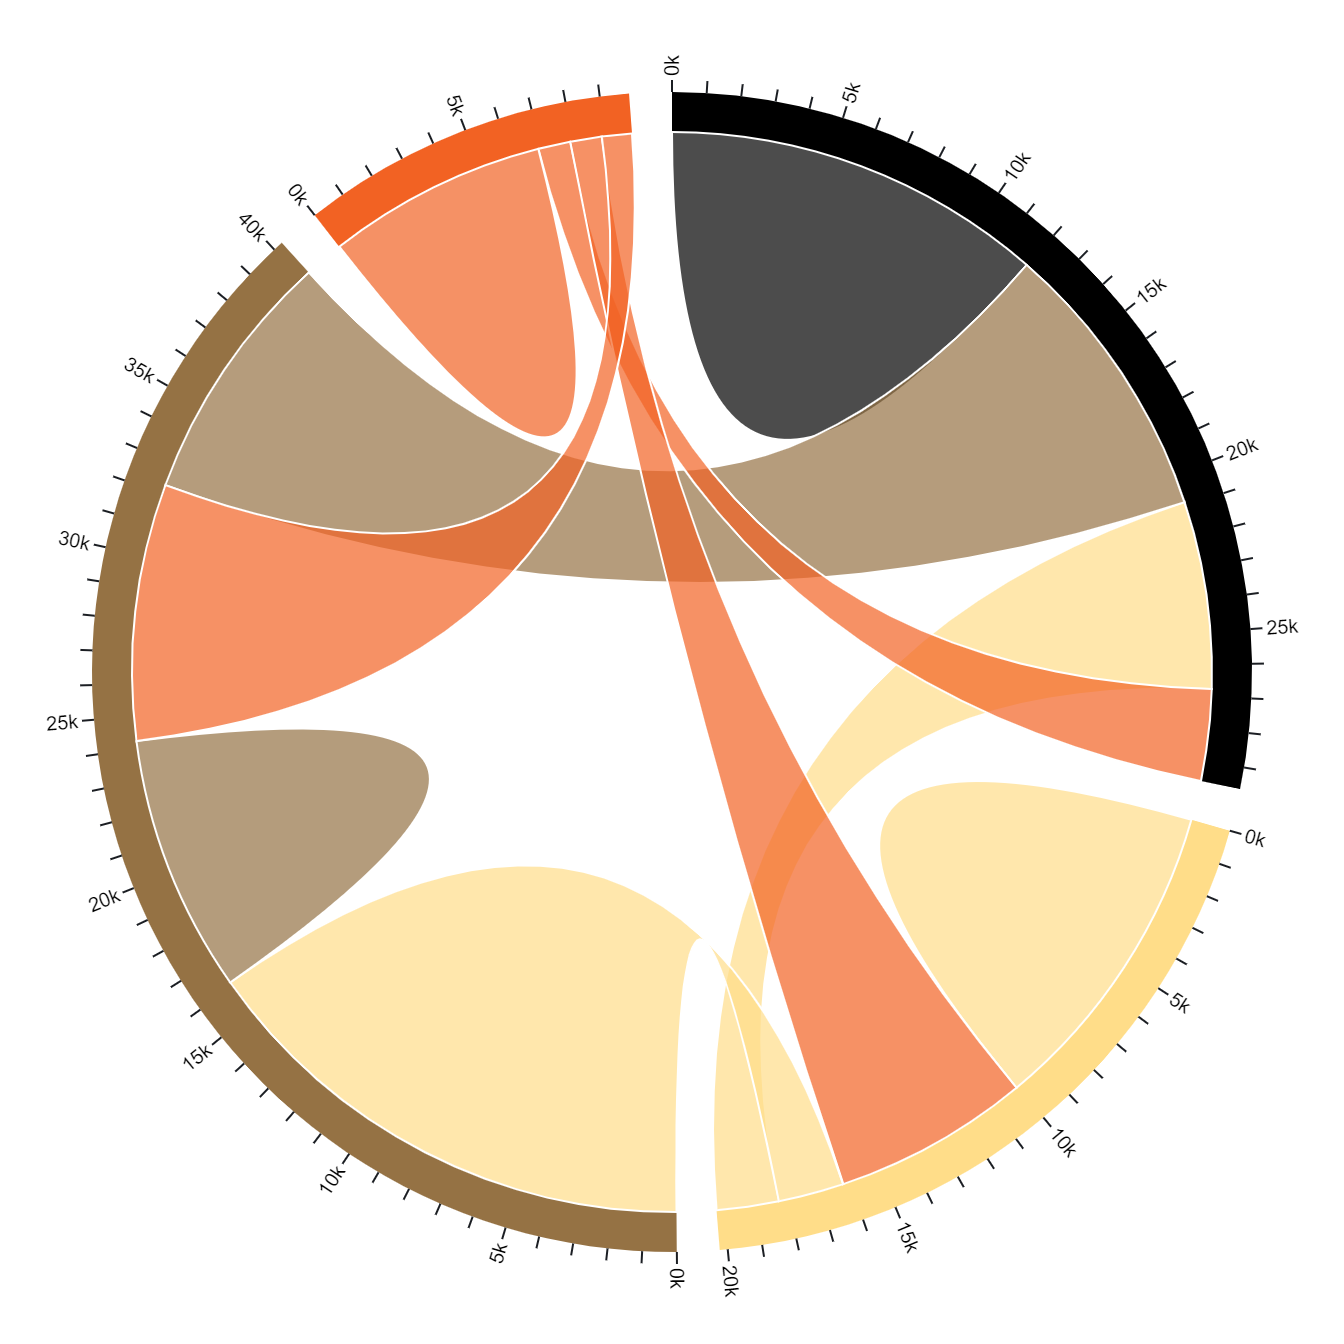
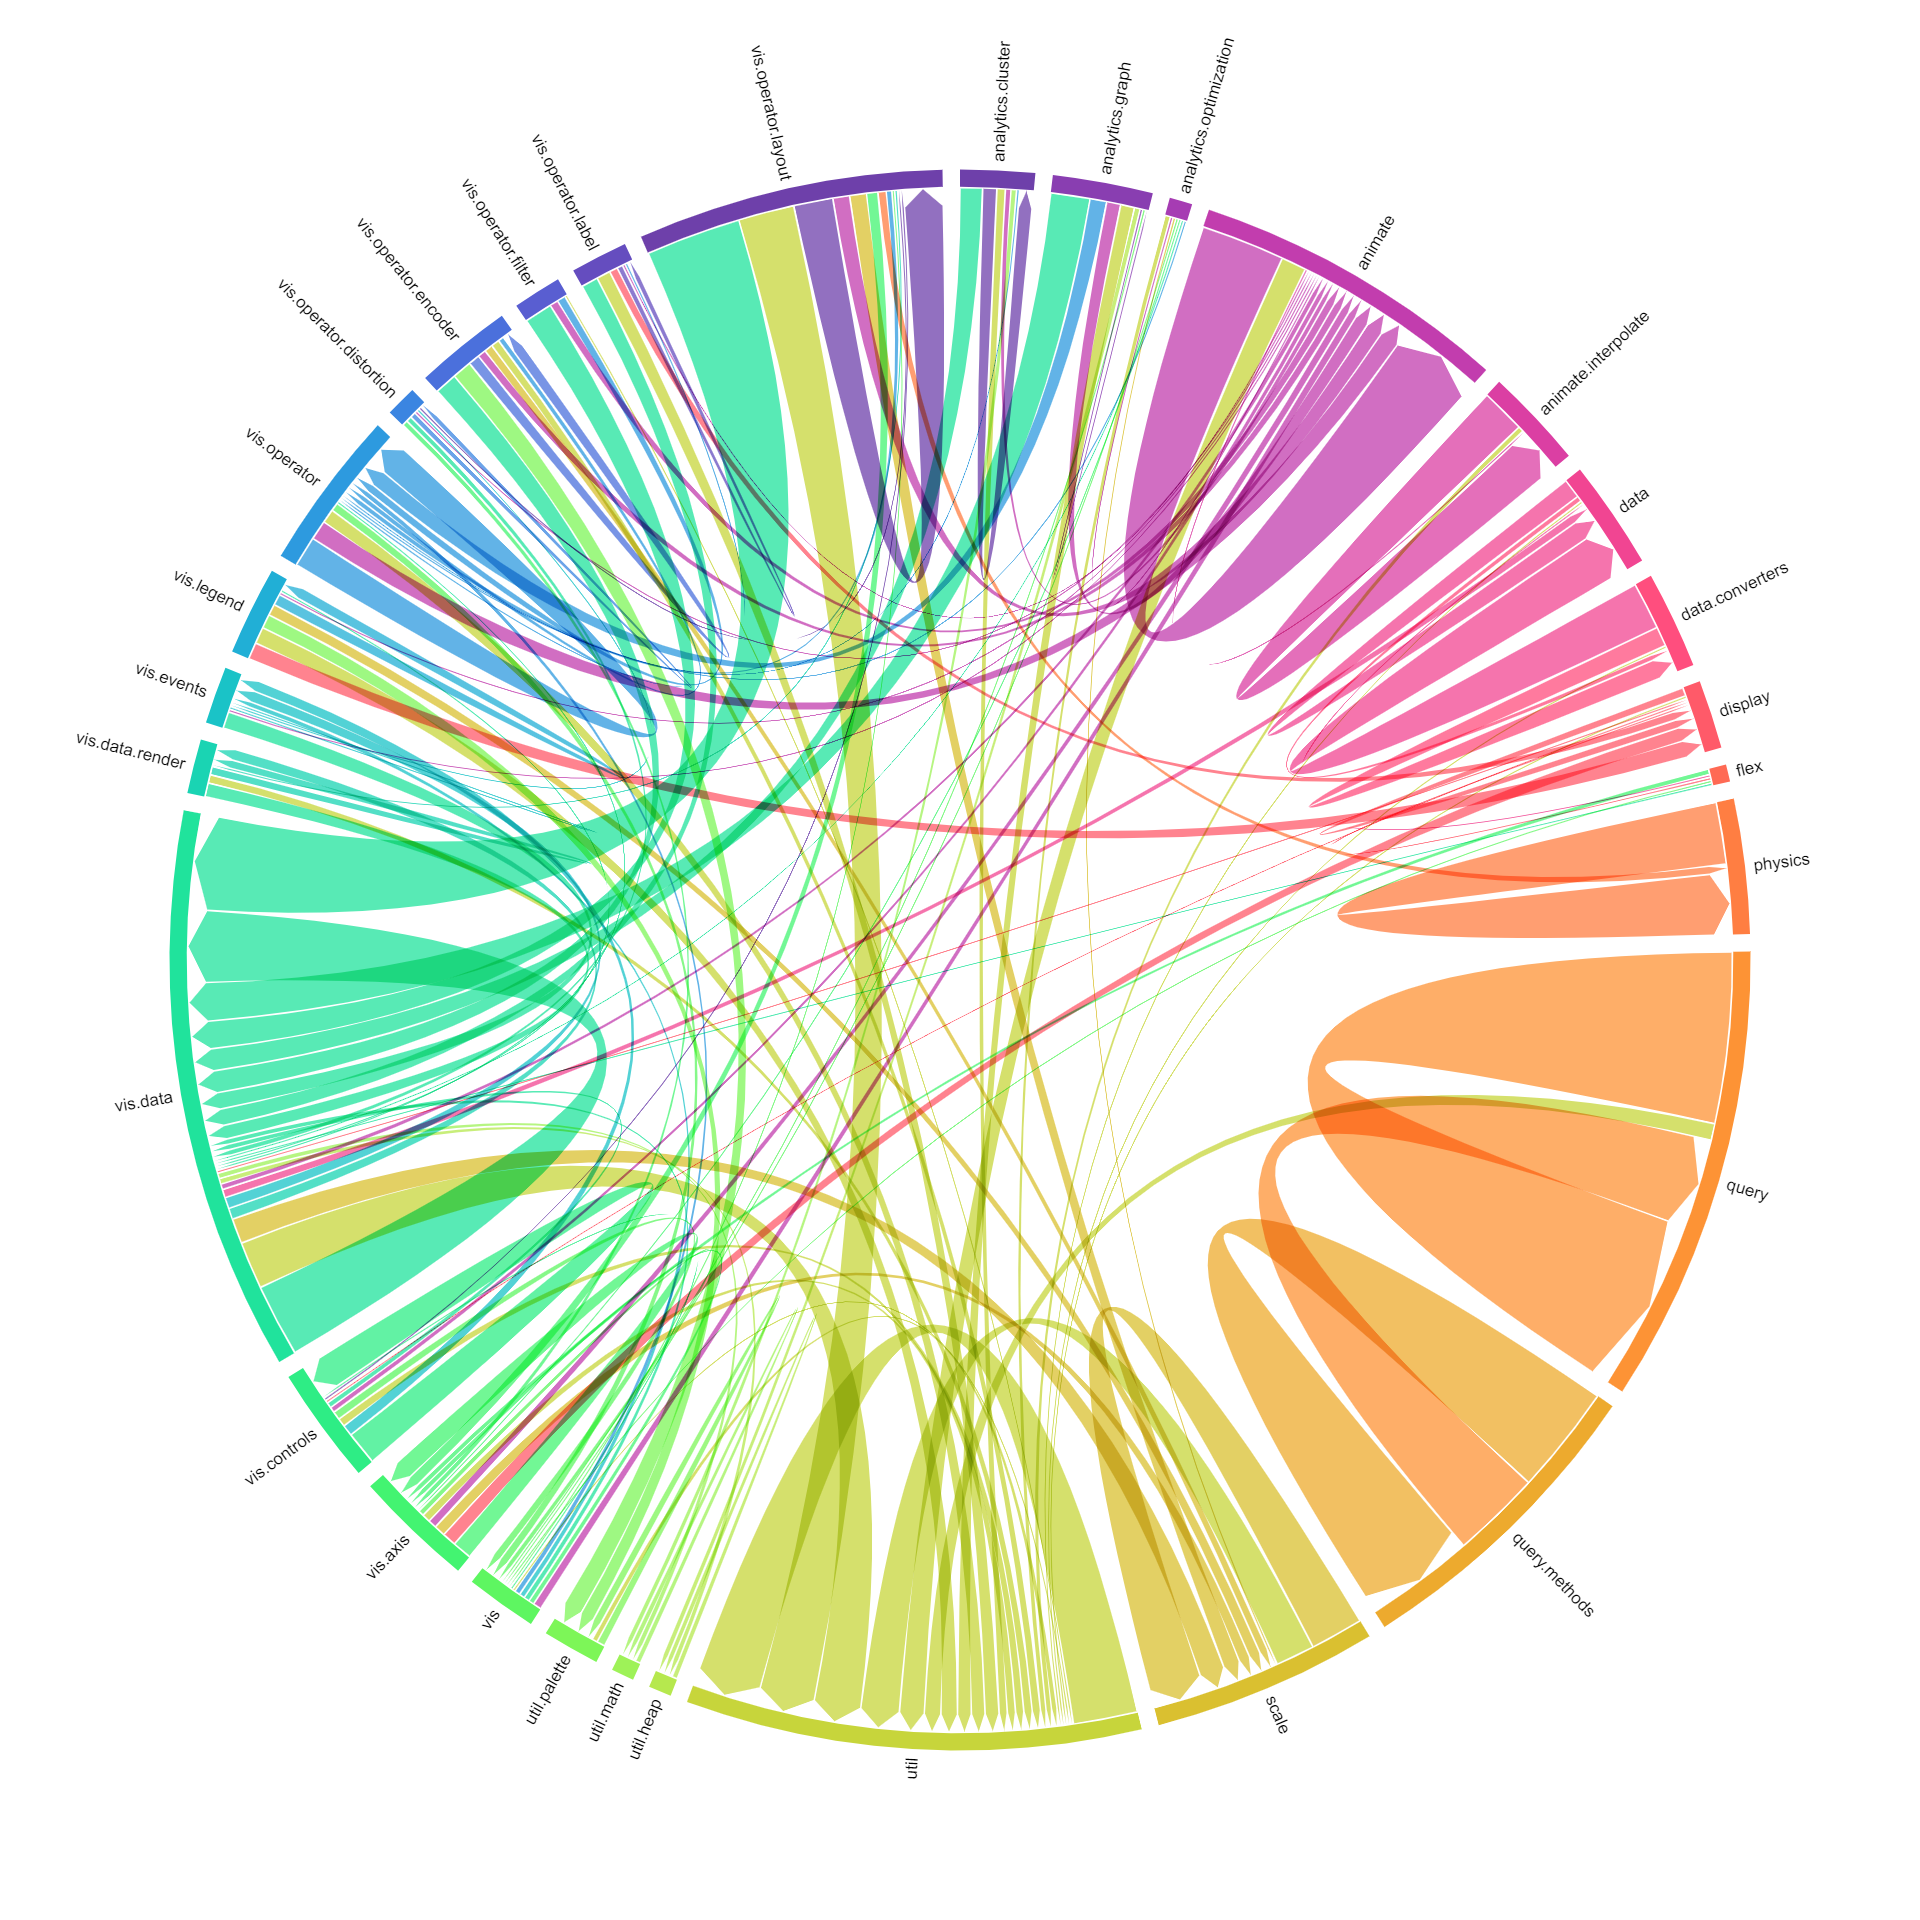
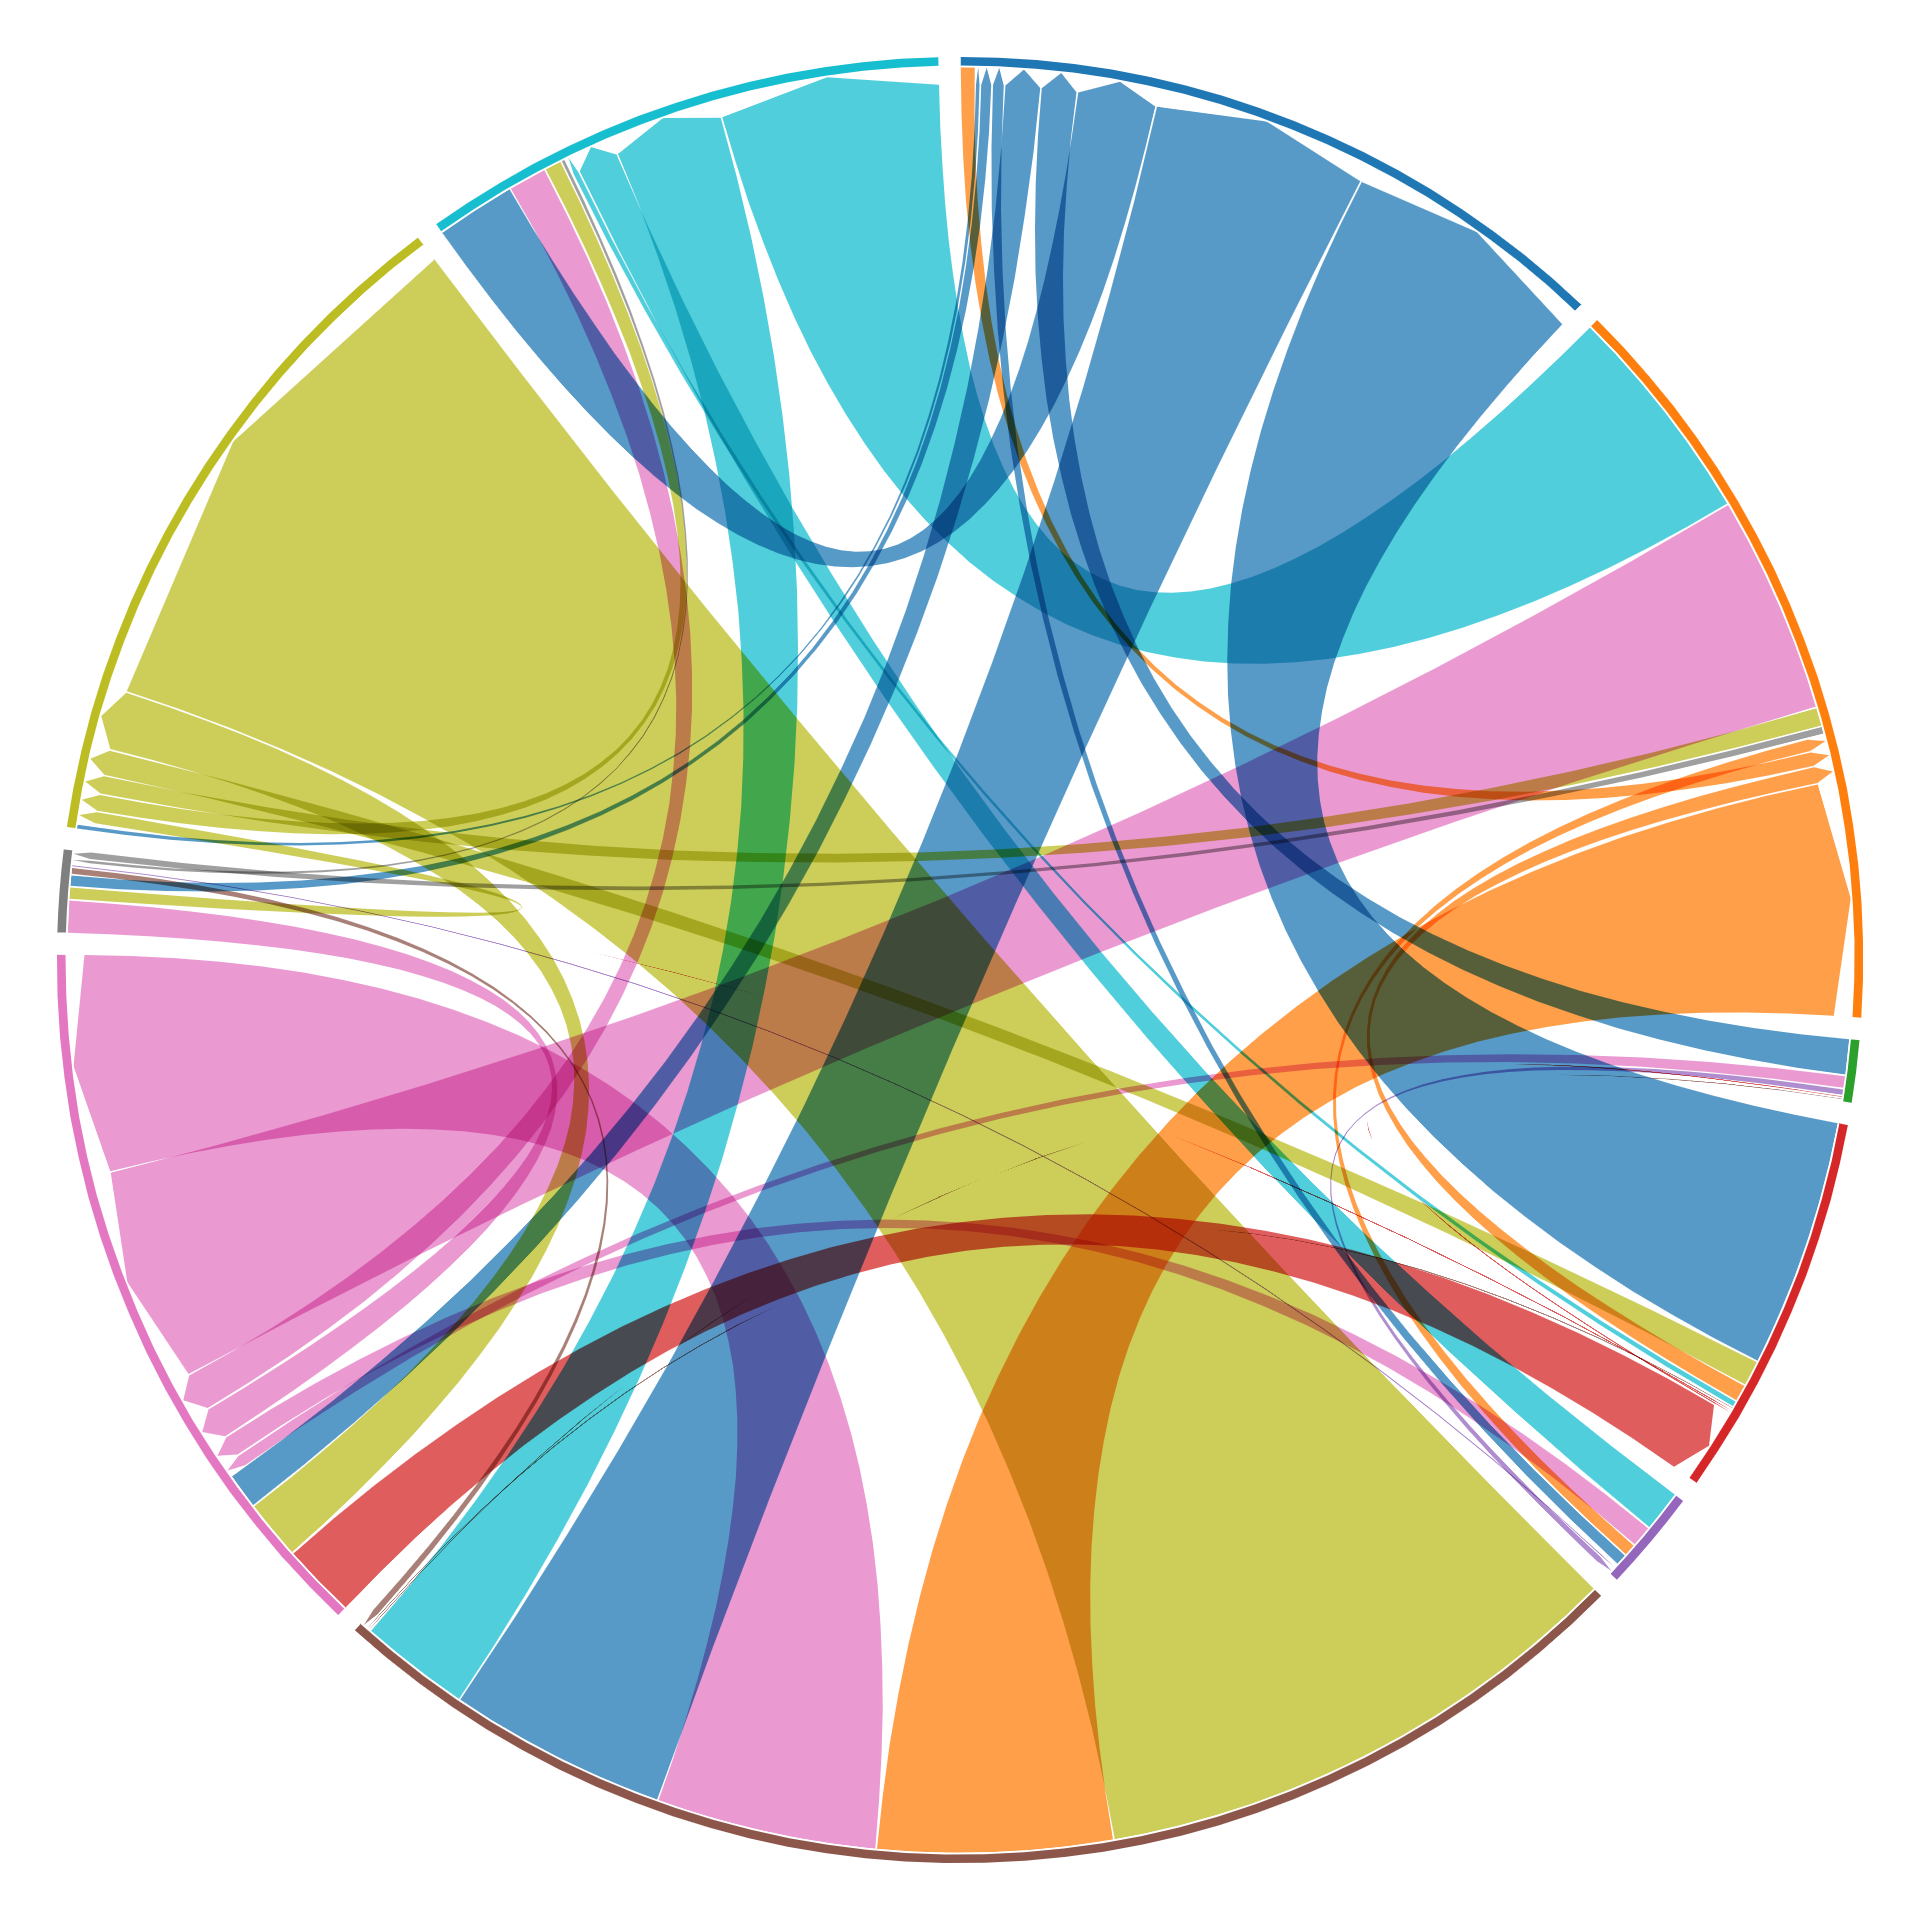
A directed chord diagram is a visual representation that illustrates connections or relationships between different entities or categories. Unlike traditional chord diagrams, which display bidirectional relationships, directed chord diagrams emphasize the directionality of connections, often through the use of arrows or directional cues. These diagrams are useful for visualizing flows of information, dependencies, or interactions in complex systems, networks, or processes. They provide a clear and concise way to understand the direction of influence or dependencies between various elements within a dataset or system.

Purposes  :

The purposes of a directed chord diagram include:

  1. Visualizing Flow of Information: Directed chord diagrams are useful for visualizing the flow of information, resources, or dependencies between different entities or categories. They provide a clear representation of the directionality of connections, allowing viewers to understand how data or resources move through a system.
  2. Understanding Interactions: These diagrams help in understanding the interactions and dependencies between different components or variables within a system. By visualizing the direction of connections, users can identify which entities influence or depend on each other.
  3. Analyzing Network Structures: Directed chord diagrams are commonly used in network analysis to visualize the structure and connectivity of directed networks. They help in identifying patterns, clusters, and pathways within the network, as well as analyzing the strength and directionality of connections.
  4. Identifying Dependencies: Directed chord diagrams aid in identifying dependencies or causal relationships between different elements in a dataset or system. By observing the direction of arrows or connections, users can identify which entities are influenced by others and how changes in one component may affect others.
  5. Detecting Patterns and Trends: These diagrams help in detecting patterns or trends in the flow of information or dependencies. Users can observe the directionality of connections and identify recurring patterns or trends that may impact decision-making or system design.
  6. Enhancing Data Presentation: Directed chord diagrams provide a visually appealing way to present complex relationships or dependencies in a dataset. Their clear visualization of directionality and connections makes them an effective tool for communicating insights to stakeholders.

Overall, the purposes of a directed chord diagram revolve around visualizing flow of information, understanding interactions, analyzing network structures, identifying dependencies, detecting patterns and trends, and enhancing the presentation of data in various domains and applications.

Uses :

The uses of a directed chord diagram include:

  1. Network Analysis: Directed chord diagrams are commonly used in network analysis to visualize and analyze the structure and connectivity of directed networks. They help in understanding how entities within the network are connected and how information or resources flow through the network.
  2. Flow Visualization: These diagrams are useful for visualizing the flow of information, resources, or dependencies between different entities or categories in a system. They provide a clear representation of the directionality of connections, allowing viewers to understand how data moves through the system.
  3. Dependency Analysis: Directed chord diagrams help in analyzing dependencies or causal relationships between different elements in a dataset or system. By visualizing the direction of connections, users can identify which entities influence or depend on each other.
  4. Process Mapping: These diagrams are used in process mapping to visualize the sequence of steps or activities in a process. They help in understanding the dependencies between different tasks or activities and identifying bottlenecks or areas for improvement.
  5. Gene Regulatory Networks: In biological research, directed chord diagrams are used to visualize gene regulatory networks, where genes regulate the expression of other genes. They help in understanding the complex interactions between genes and identifying key regulators in biological processes.
  6. Financial Transactions: Directed chord diagrams can be used to visualize financial transactions or flows of funds between different accounts or entities. They help in understanding how money moves through the financial system and identifying potential risks or fraudulent activities.

Overall, directed chord diagrams are versatile visualization tools that can be applied in various domains and applications to analyze network structures, visualize flow of information, conduct dependency analysis, map processes, study gene regulatory networks, and visualize financial transactions.

Reviews

There are no reviews yet.

Only logged in customers who have purchased this product may leave a review.