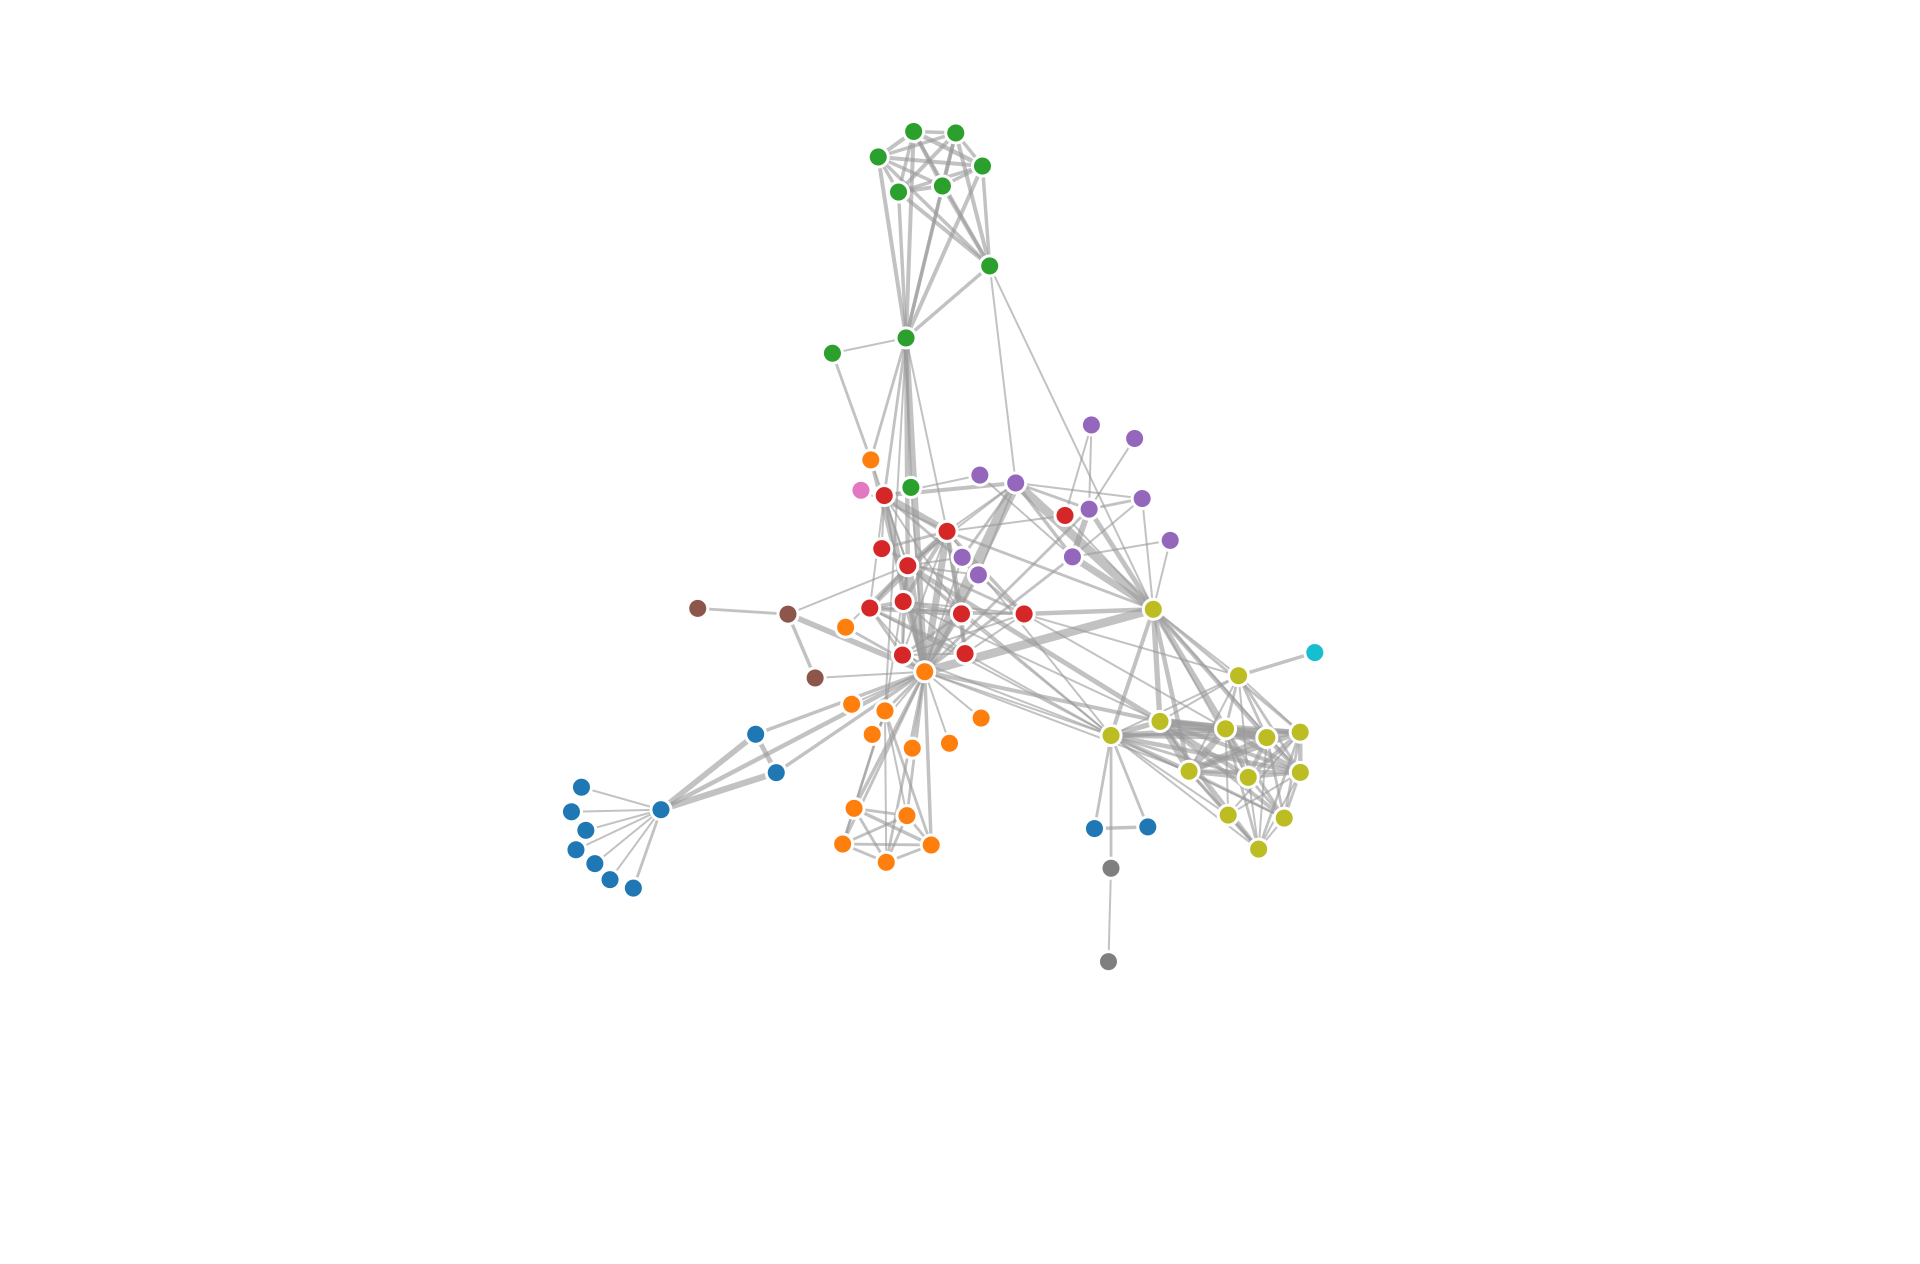
Sale!

Disjoint-Force Directed Graph

Original price was: $ 15.Current price is: $ 10.

Description

A disjoint force graph is a type of graph visualization where the nodes are arranged in a two-dimensional or three-dimensional space, but there are no edges connecting the nodes. Each node exists independently of the others, forming disjoint clusters or groups within the graph. Disjoint force graphs are useful for visualizing datasets where there is no direct connection or relationship between the individual data points or entities. They provide a clear representation of the separate components or clusters within the data, allowing analysts to identify distinct groups or patterns.

Purposes :

  1. Enhancing Visualization: Disjoint force-directed graphs help enhance the visualization of complex networks by positioning nodes and edges in a visually appealing manner that minimizes overlaps and edge crossings. This improves clarity and readability, making it easier to interpret the relationships between entities.
  2. Reducing Cognitive Load: By organizing nodes and edges to avoid overlaps and crossings, disjoint force-directed graphs reduce cognitive load for viewers. This allows users to focus on understanding the structure and connections within the network without being distracted by cluttered or ambiguous visual representations.
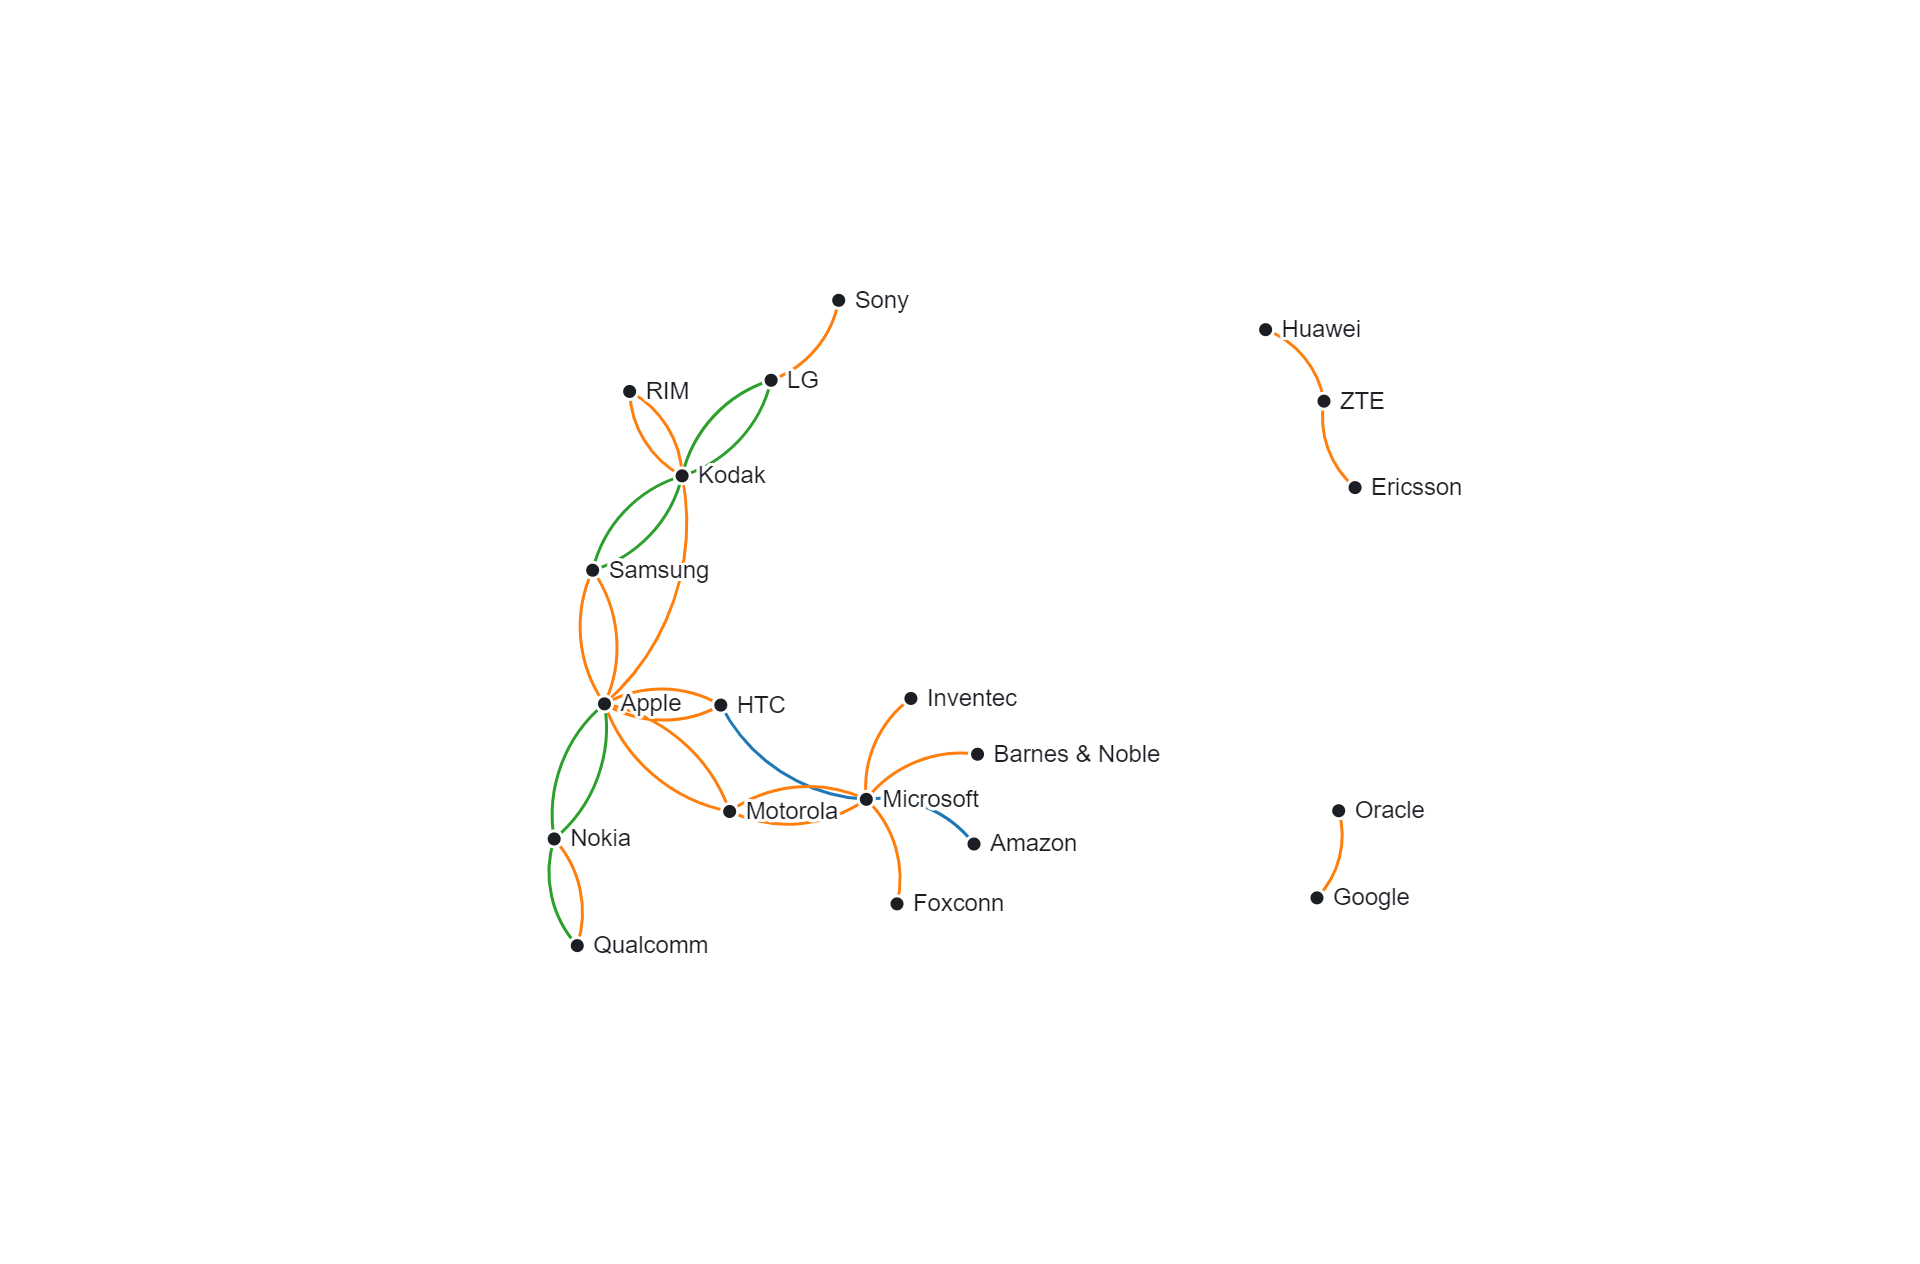
  3. Highlighting Connectivity: Disjoint force-directed graphs effectively highlight the connectivity and relationships between nodes in a network. The layout emphasizes the proximity of related nodes and the paths of connections, making it easier to identify clusters, hubs, and other structural properties of the network.
  4. Supporting Analysis: The clear and intuitive visualization provided by disjoint force-directed graphs supports analysis of network properties, such as centrality, clustering, and modularity. Researchers and analysts can gain insights into the organization and dynamics of complex networks, facilitating further investigation and understanding.
  5. Facilitating Communication: Disjoint force-directed graphs serve as effective communication tools for conveying complex network structures and relationships to diverse audiences. The visually appealing layout helps stakeholders grasp key insights and concepts, enabling more effective communication and collaboration.
  6. Improving User Interaction: Disjoint force-directed graphs can be interactive, allowing users to explore the network by manipulating nodes and edges. Interactive features such as zooming, panning, and filtering enhance user engagement and facilitate exploration of large-scale networks.
  7. Enabling Comparative Analysis: Disjoint force-directed graphs can be used to compare multiple networks or different states of the same network. By visually juxtaposing the layouts of different graphs, users can identify similarities, differences, and changes in network structure over time or across conditions.

Uses :

  1. Network Visualization: Disjoint force-directed graphs are widely used for visualizing complex networks in fields such as social network analysis, biological networks, transportation networks, and computer networks. They provide a clear and intuitive representation of the relationships between entities (nodes) and connections (edges) within the network.
  2. Data Analysis and Exploration: These graphs facilitate the exploration and analysis of network data by visually representing the structure, connectivity, and clustering of nodes. Researchers and analysts can identify patterns, clusters, and hubs within the network, leading to insights into its organization and dynamics.
  3. Community Detection: Disjoint force-directed graphs aid in detecting communities or clusters within a network, where nodes within the same community are densely connected while having fewer connections to nodes in other communities. This helps in understanding the modular structure of complex networks.
  4. Centrality Analysis: These graphs assist in analyzing node centrality measures, such as degree centrality, betweenness centrality, and eigenvector centrality, which identify important nodes based on their connectivity and influence within the network.
  5. Visualization of Graph Algorithms: Disjoint force-directed graphs are used to visualize the output of various graph algorithms, such as shortest path algorithms, minimum spanning tree algorithms, and graph clustering algorithms. The visual representation helps in understanding the algorithm’s behavior and output.
  6. Communication and Presentation: Disjoint force-directed graphs serve as effective communication tools for presenting network-related findings to stakeholders, decision-makers, and the general audience. They offer a visually appealing way to convey complex network structures and relationships in a clear and understandable manner.
  7. Software Visualization: In software engineering, these graphs are employed to visualize software dependencies, call graphs, and class hierarchies. They aid in understanding the architecture and structure of software systems, facilitating software maintenance, refactoring, and debugging.
  8. Interactive Data Exploration: Disjoint force-directed graphs can be made interactive, allowing users to explore the network by zooming, panning, filtering, and selecting nodes and edges. Interactive features enhance user engagement and enable dynamic exploration of large-scale networks.

.


Reviews

There are no reviews yet.

Only logged in customers who have purchased this product may leave a review.