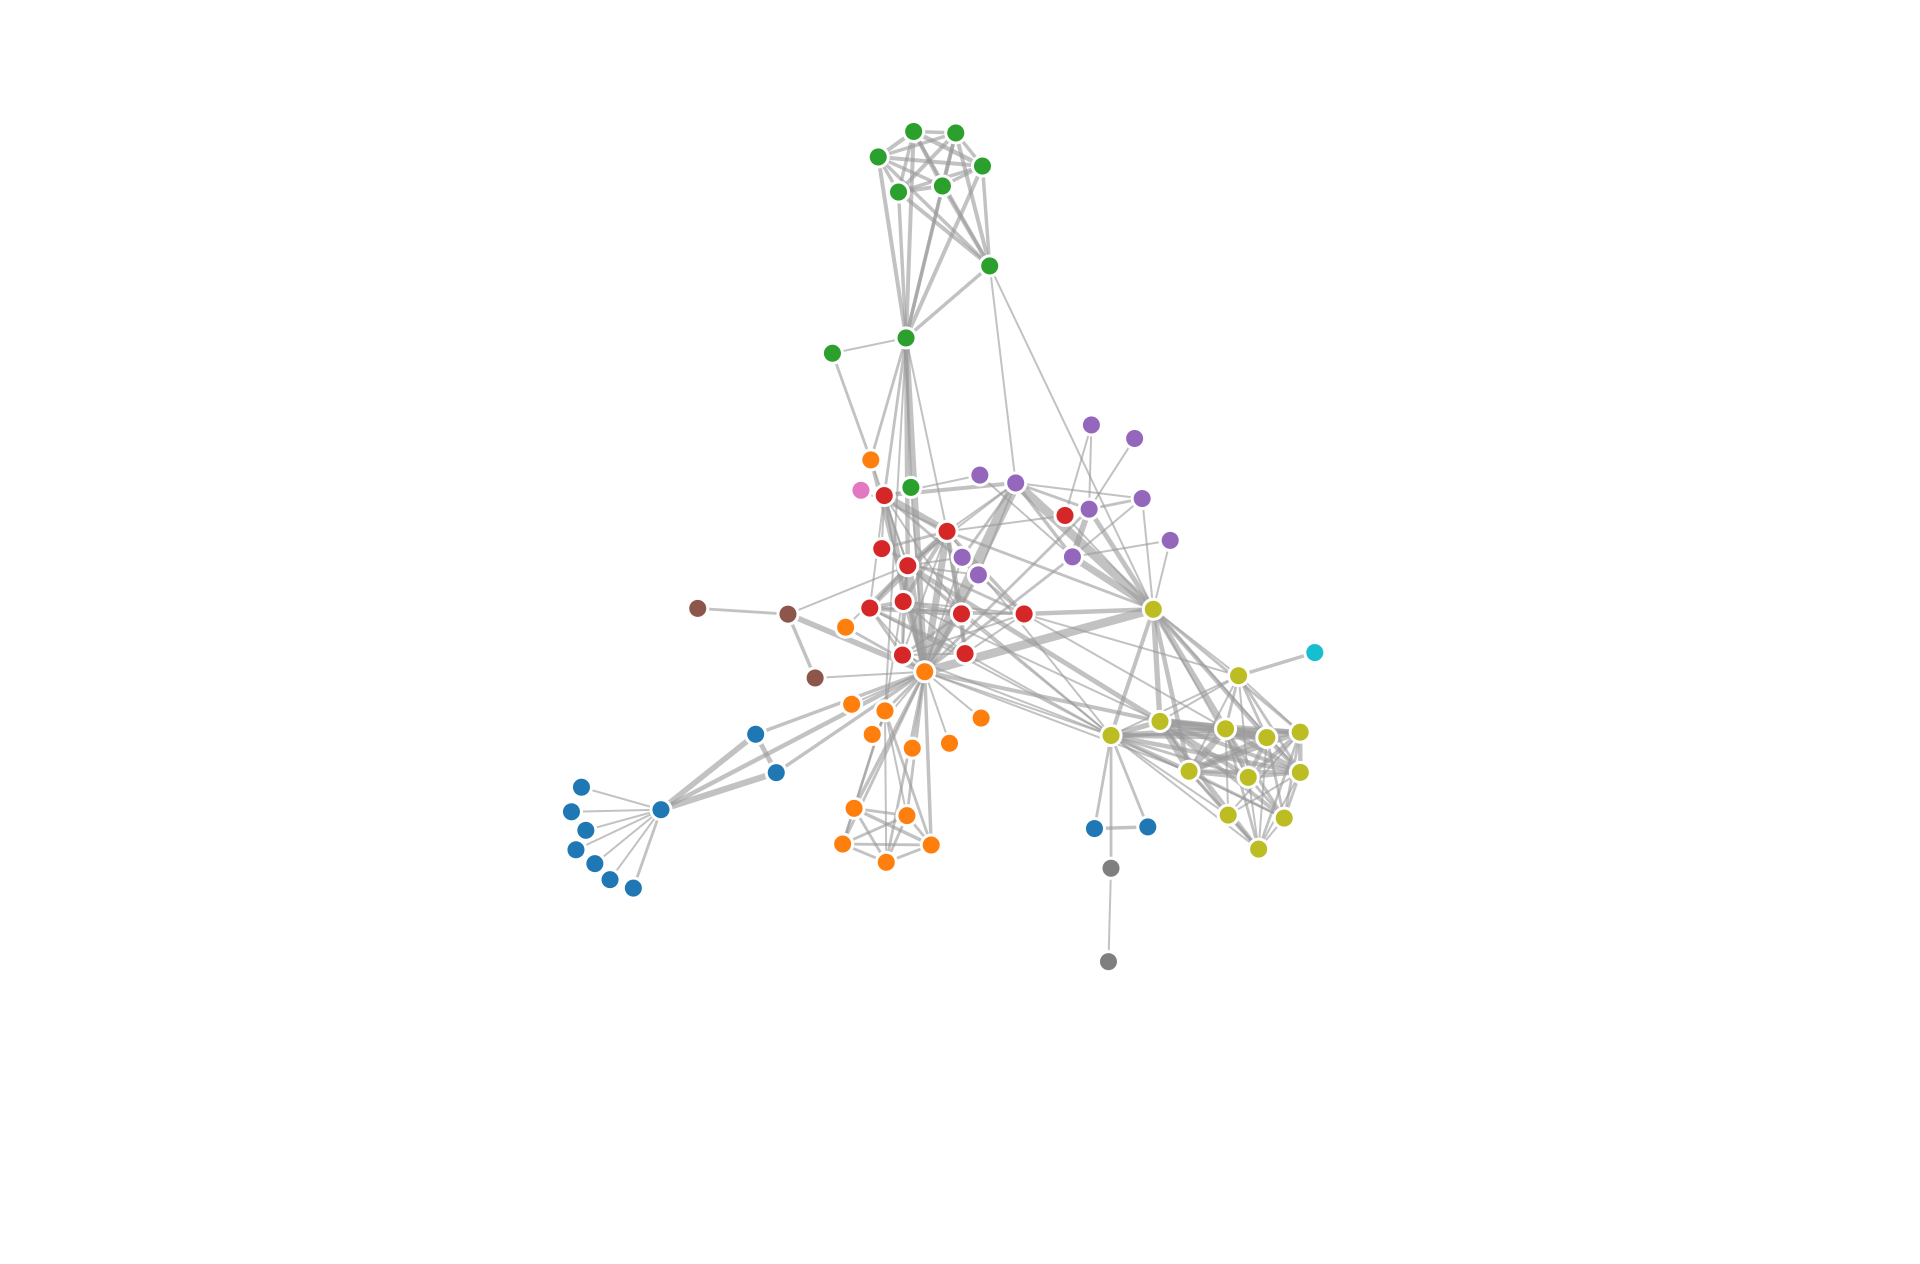
A force-directed algorithm is a computational method used to visualize complex networks or graphs. It simulates physical forces between nodes in the network to determine their positions in a two-dimensional or three-dimensional space.Force-directed algorithms are commonly used in network analysis and visualization to explore relationships and patterns within large and interconnected datasets.
Purposes :
Network Visualization: Force-directed graphs are primarily used for visualizing complex networks, such as social networks, biological networks, and computer networks. They provide an intuitive representation of the relationships between nodes and edges in the network.
Layout Optimization: These graphs aim to optimize the arrangement of nodes and edges in a visually pleasing manner. By simulating physical forces, force-directed layouts minimize edge crossings and overlapping nodes, enhancing the readability and aesthetics of the visualization.
Exploratory Data Analysis: Force-directed graphs facilitate exploratory data analysis by allowing users to interactively explore the network structure. Users can manipulate the graph layout, zoom in/out, and pan to gain insights into the underlying patterns, clusters, and communities within the network.
Community Detection: Force-directed layouts help in identifying communities or clusters within a network based on the density of connections between nodes. Nodes within the same community tend to be spatially grouped together, making it easier to detect and analyze modular structures in the network.
Centrality Analysis: These graphs enable the analysis of node centrality measures, such as degree centrality, betweenness centrality, and eigenvector centrality. Nodes with higher centrality values are typically positioned closer to the center of the graph or have more connections, indicating their importance within the network.
Pattern Recognition: Force-directed graphs aid in recognizing patterns and trends within the network, such as hubs, bridges, and cliques. By visually inspecting the layout of the graph, users can identify key features and anomalies that may require further investigation.
Communication and Presentation: Force-directed layouts serve as effective communication tools for presenting network-related findings to a wider audience. They offer visually appealing visualizations that convey complex network structures and relationships in a clear and understandable manner.
Algorithm Visualization: Force-directed graphs are used to visualize the output of various graph algorithms, such as shortest path algorithms, minimum spanning tree algorithms, and graph clustering algorithms. The visual representation helps in understanding the algorithm’s behavior and output.
Uses :
Network Visualization: They are primarily used to visualize complex networks, such as social networks, biological networks, and computer networks. Force-directed layouts provide an intuitive and visually appealing representation of the relationships between nodes and edges in the network.
Exploratory Data Analysis: Force-directed graphs facilitate exploratory data analysis by allowing users to interactively explore the network structure. Users can manipulate the graph layout, zoom in/out, and pan to gain insights into the underlying patterns, clusters, and communities within the network.
Community Detection: These graphs help in identifying communities or clusters within a network based on the density of connections between nodes. Nodes within the same community tend to be spatially grouped together, making it easier to detect and analyze modular structures in the network.
Centrality Analysis: Force-directed layouts enable the analysis of node centrality measures, such as degree centrality, betweenness centrality, and eigenvector centrality. Nodes with higher centrality values are typically positioned closer to the center of the graph or have more connections, indicating their importance within the network.
Pattern Recognition: Force-directed graphs aid in recognizing patterns and trends within the network, such as hubs, bridges, and cliques. By visually inspecting the layout of the graph, users can identify key features and anomalies that may require further investigation.
Communication and Presentation: Force-directed layouts serve as effective communication tools for presenting network-related findings to a wider audience. They offer visually appealing visualizations that convey complex network structures and relationships in a clear and understandable manner.
Algorithm Visualization: Force-directed graphs are used to visualize the output of various graph algorithms, such as shortest path algorithms, minimum spanning tree algorithms, and graph clustering algorithms. The visual representation helps in understanding the algorithm’s behavior and output.
Reviews
There are no reviews yet.
Only logged in customers who have purchased this product may leave a review.
")
")
Reviews
There are no reviews yet.