Sale!
Description
Description :
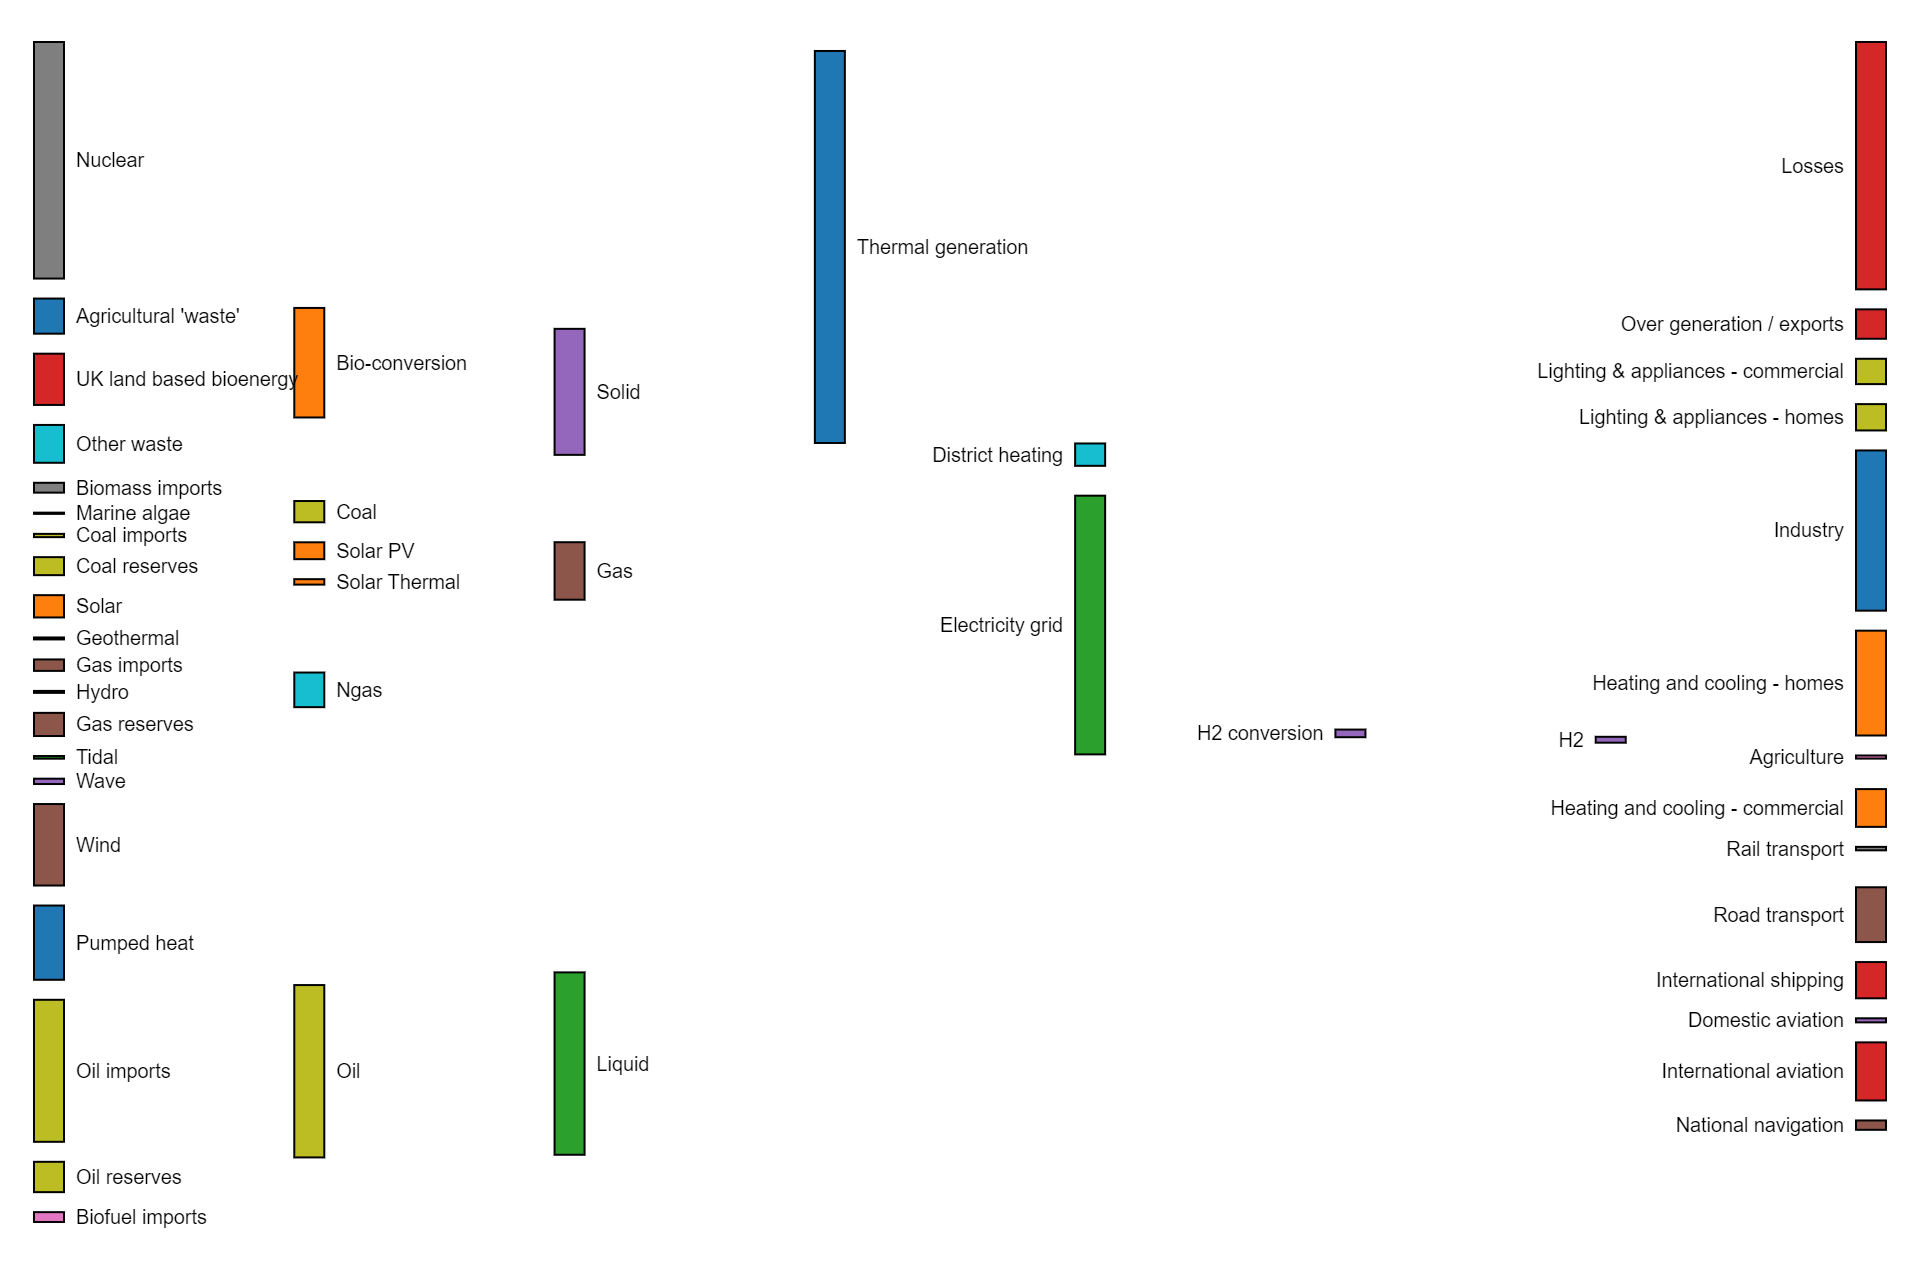
A Sankey diagram is a visual representation that illustrates the flow of energy, resources, or quantities between different entities. It uses proportional arrow widths to show the magnitude of the flow, allowing for a clear understanding of how inputs are transformed into outputs within a system or process.
Purposes :
Only logged in customers who have purchased this product may leave a review.

Reviews
There are no reviews yet.