Sorted radial stacked bar chart
$ 15 Original price was: $ 15.$ 10Current price is: $ 10.
Description
Description :
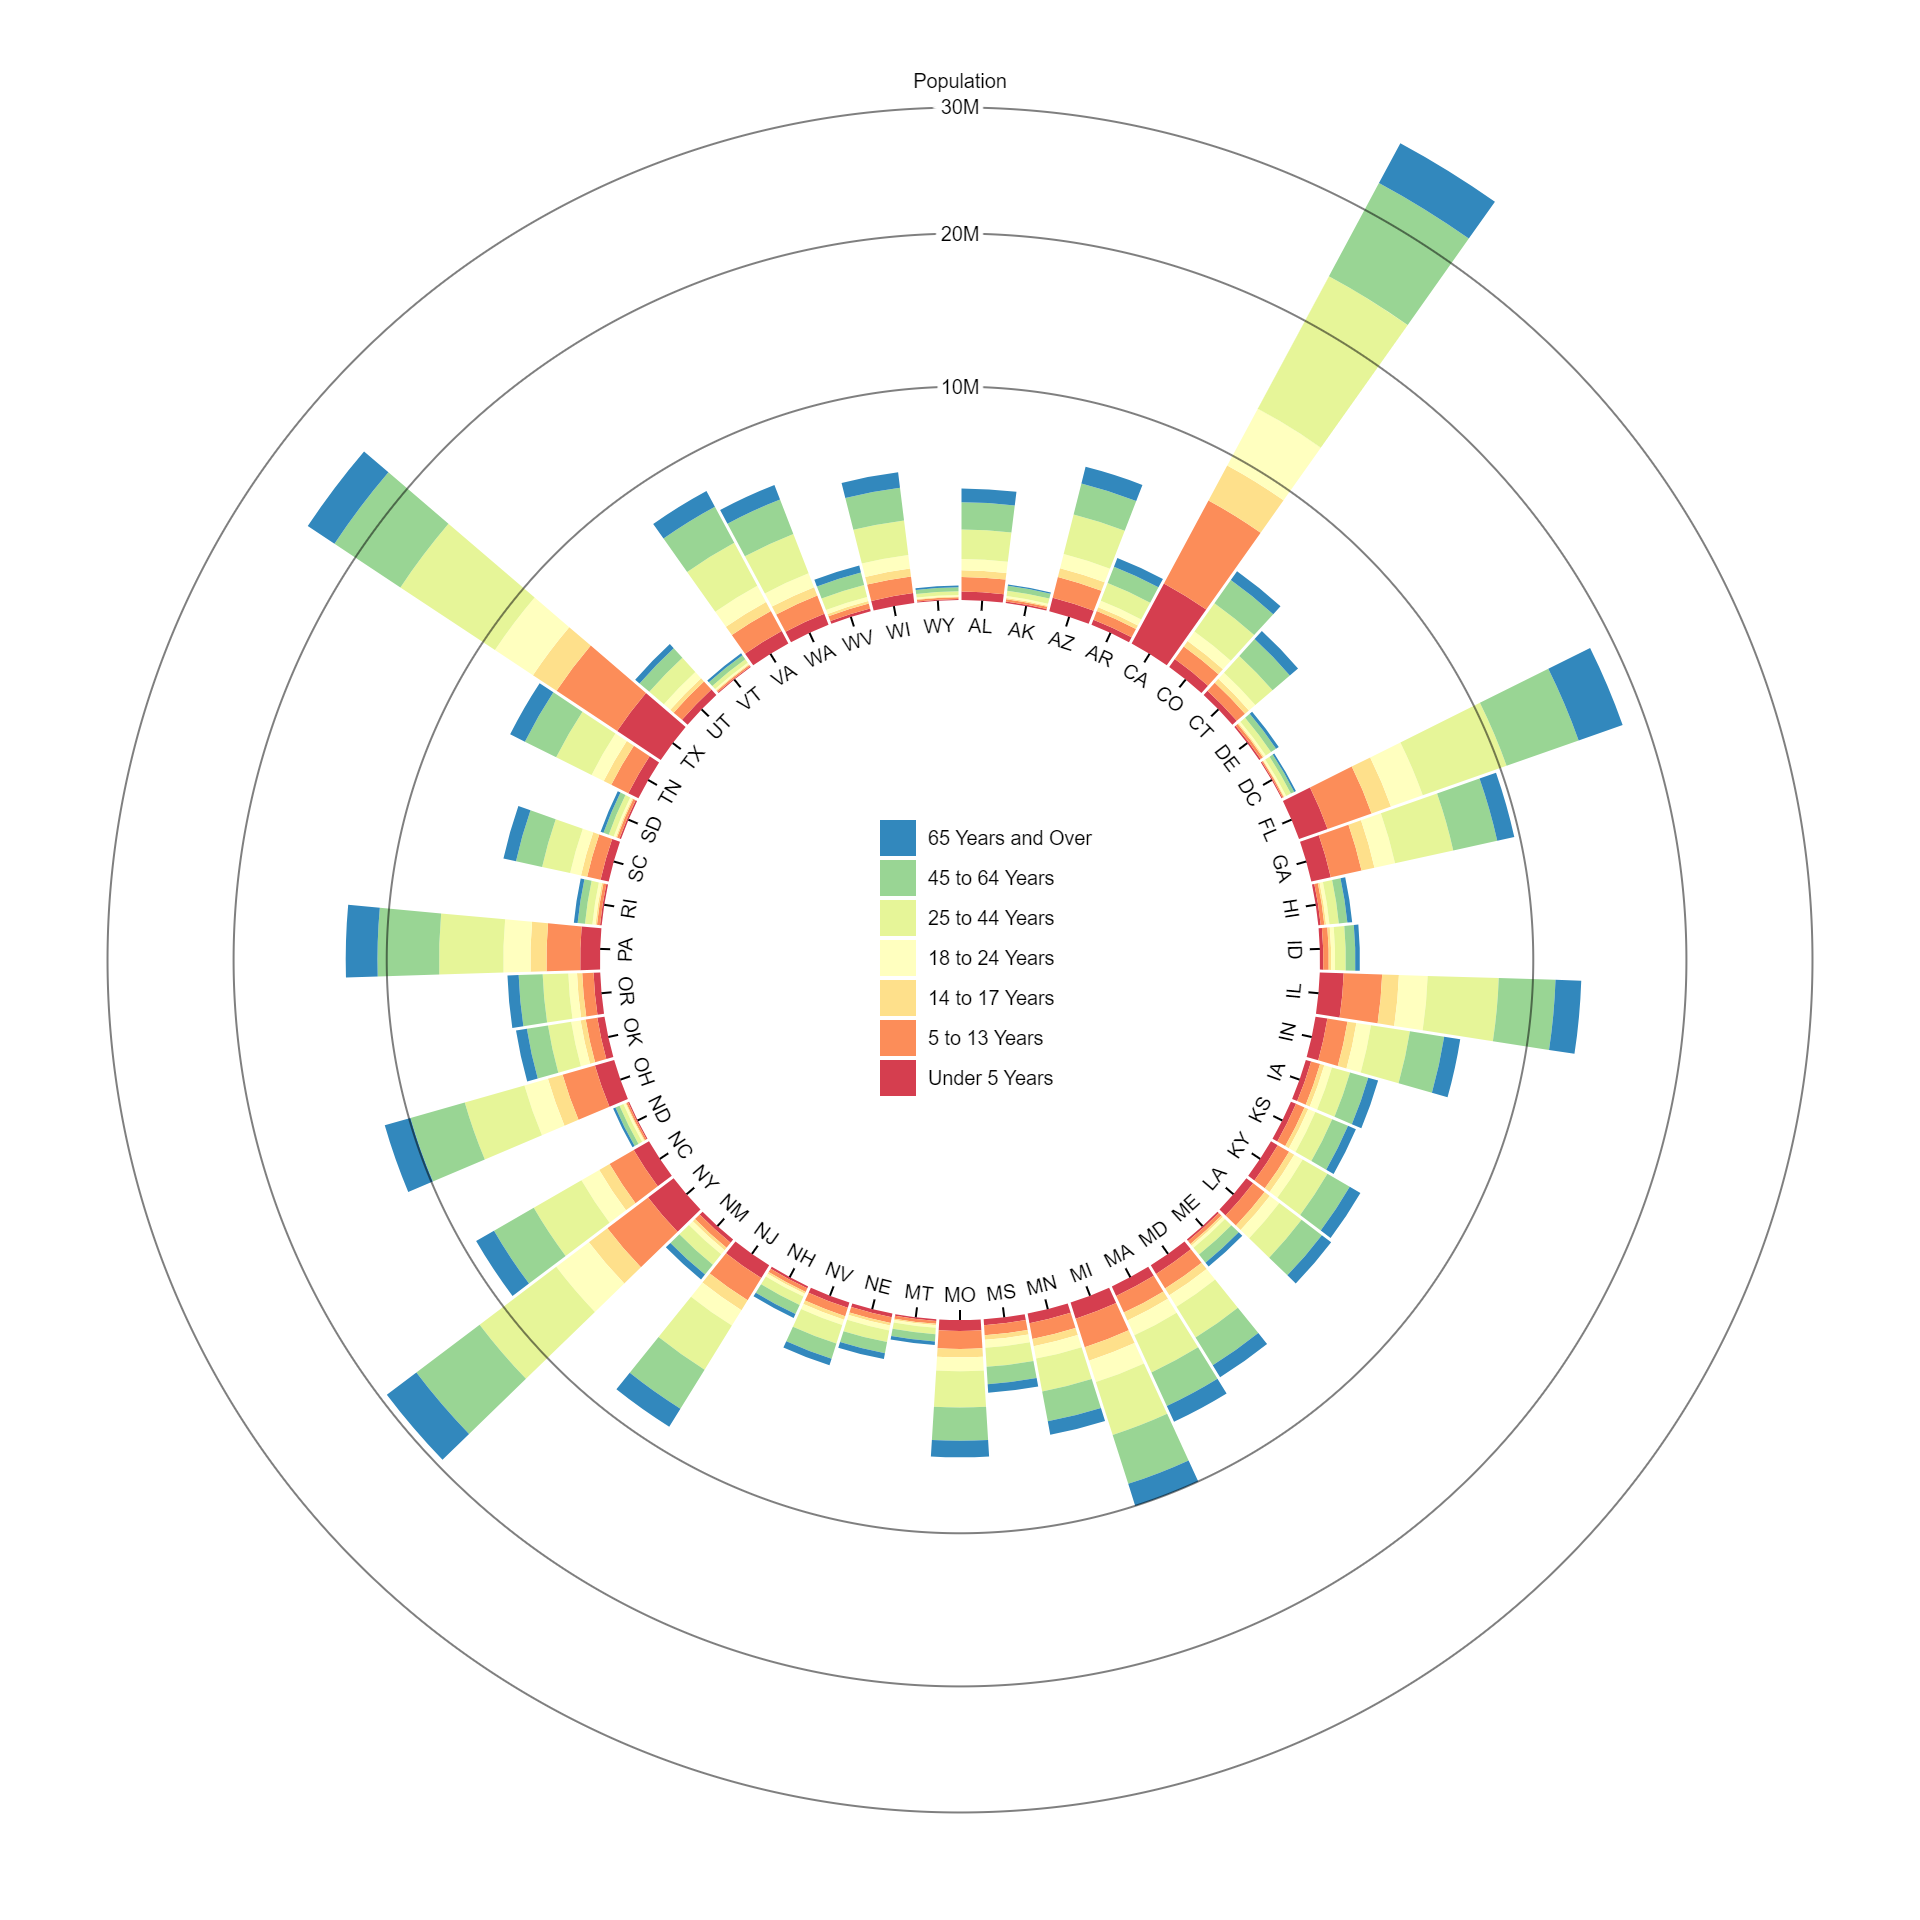
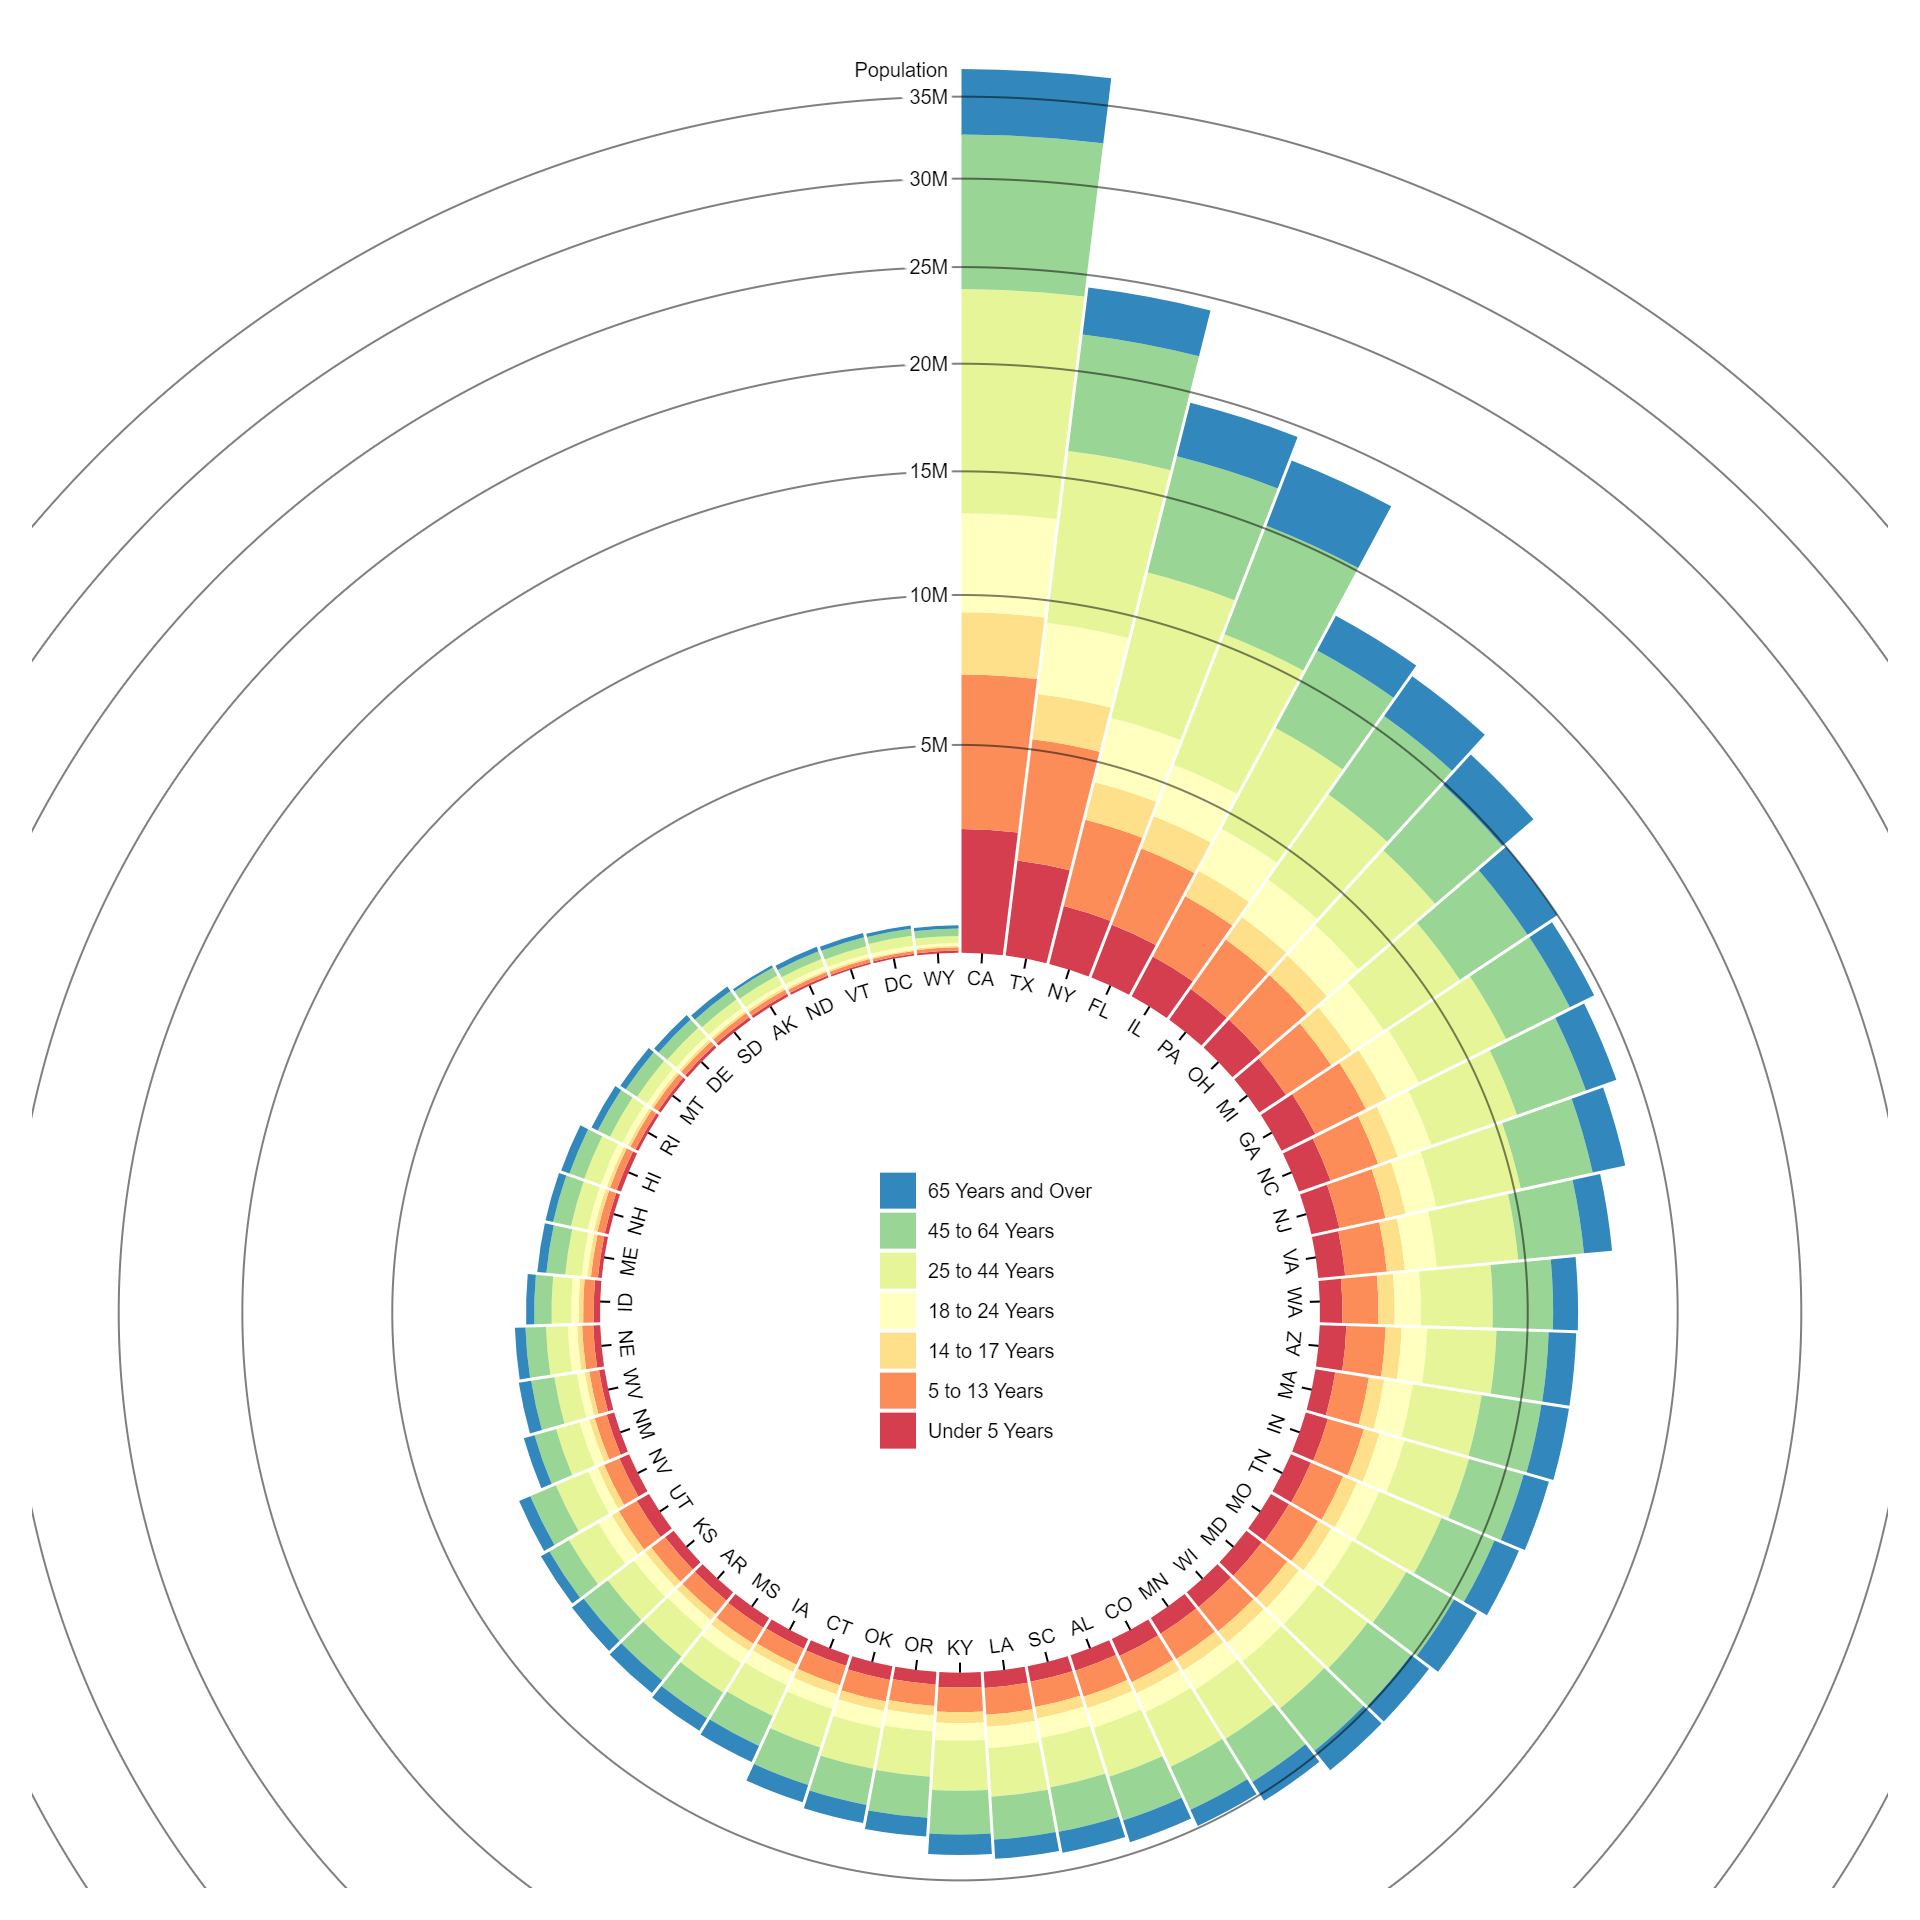
A sorted radial stacked bar chart is a circular data visualization where categorical data is displayed using stacked bars arranged radially around a central point. Unlike a traditional radial stacked bar chart, the bars in a sorted radial stacked bar chart are sorted based on a specified criterion, such as the total value of each category or the alphabetical order of category labels. This sorting helps in organizing the data for easier comparison and interpretation, allowing viewers to quickly identify patterns and trends within the dataset.
The purpose of a sorted radial stacked bar chart includes:
- Improved Visualization: By sorting the bars based on a specified criterion, such as total value or alphabetical order, the chart becomes more organized and easier to interpret. This enhances the visual clarity of the data presentation and allows viewers to quickly identify patterns and trends.
- Facilitates Comparison: Sorting the bars in a radial stacked bar chart makes it easier to compare the values of different categories within each group or data series. Viewers can easily see which categories contribute the most or least to the total value, aiding in data analysis and decision-making.
- Enhances Understanding: The sorted arrangement of bars helps viewers understand the hierarchical or nested structure of the data more intuitively. It allows them to grasp the relative importance of different categories and how they contribute to the overall composition of each group.
- Identifies Patterns: By organizing the bars based on a specific criterion, sorted radial stacked bar charts can reveal patterns or trends that may not be immediately apparent in unsorted charts. This can lead to deeper insights and better understanding of the underlying data.
- Supports Decision Making: The clarity and ease of comparison provided by sorted radial stacked bar charts make them valuable tools for decision-making processes. Stakeholders can use the visualizations to assess performance, identify areas for improvement, and make informed decisions based on the data presented.
Overall, the purpose of a sorted radial stacked bar chart is to provide a clear, organized, and intuitive visualization of categorical data, facilitating comparison, analysis, understanding, and decision-making.
The uses of a sorted stacked bar chart include:
- Comparative Analysis: Sorted stacked bar charts are used to compare the composition of different categories within each group or data series. By sorting the bars based on a specific criterion, such as total value or alphabetical order, users can easily compare the contributions of different categories and identify patterns or trends.
- Identifying Trends: These charts help in identifying trends or patterns in the data by visually representing the distribution of values across categories within each group. Users can observe which categories are predominant or have higher values, aiding in trend analysis and decision-making.
- Highlighting Differences: Sorted stacked bar charts are useful for highlighting differences in the composition of data between groups or data series. Users can quickly identify disparities or outliers by comparing the lengths of bars across different categories within each group.
- Data Exploration: These charts facilitate data exploration by organizing the bars in a visually intuitive manner. Users can easily navigate through the data and gain insights into the hierarchical or nested structure of the dataset, helping in understanding and analysis.
- Communicating Insights: Sorted stacked bar charts serve as effective communication tools for presenting insights and findings to stakeholders. The organized layout and clear representation of data make it easier for viewers to grasp key information and make informed decisions based on the visualized data.
- Supporting Decision-making: These charts aid decision-making processes by providing stakeholders with a clear understanding of the data. Decision-makers can use the insights gained from sorted stacked bar charts to assess performance, identify areas for improvement, and make strategic decisions.
Overall, the uses of sorted stacked bar charts span various domains and applications, including data analysis, trend identification, comparative analysis, data exploration, communication of insights, and decision-making support.
Only logged in customers who have purchased this product may leave a review.
Related products
-
- Sale!
Indented Tree
-
$ 15Original price was: $ 15.$ 10Current price is: $ 10. - Add to cart
-
- Sale!
Contours
-
$ 15Original price was: $ 15.$ 10Current price is: $ 10. - Add to cart
-
- Sale!
Tree Map
-
$ 15Original price was: $ 15.$ 10Current price is: $ 10. - Add to cart


Reviews
There are no reviews yet.