Description
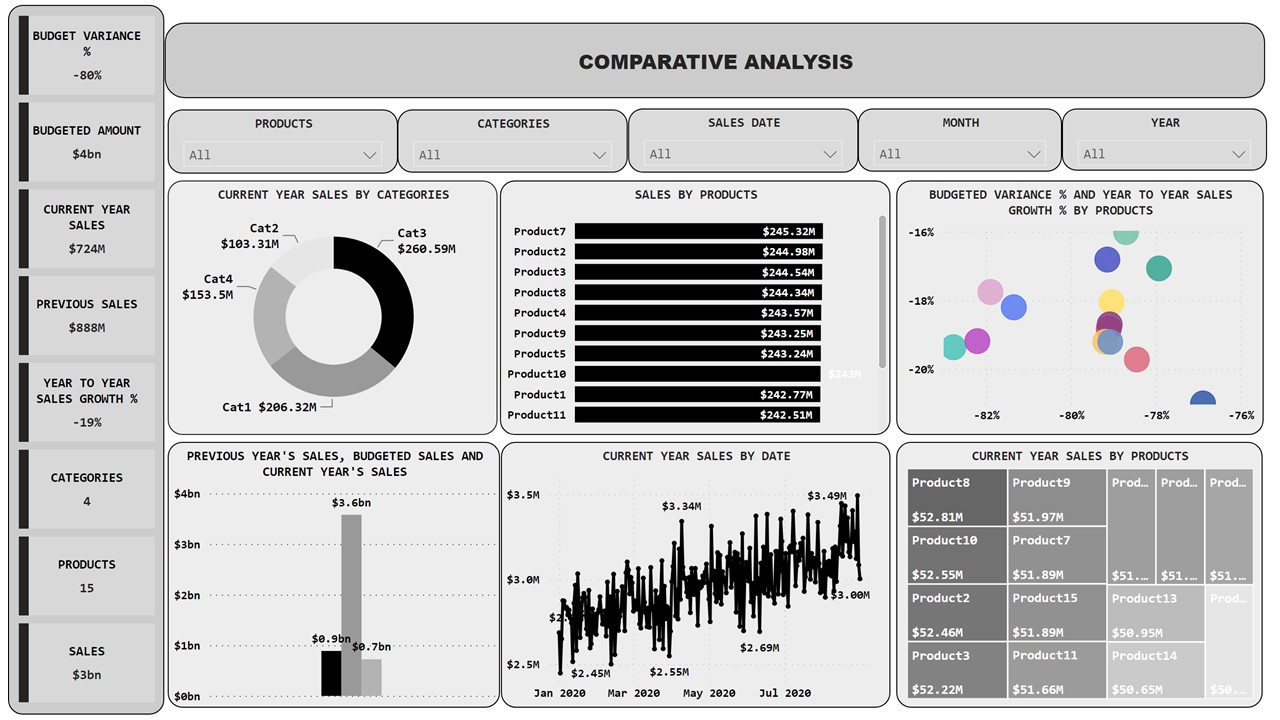
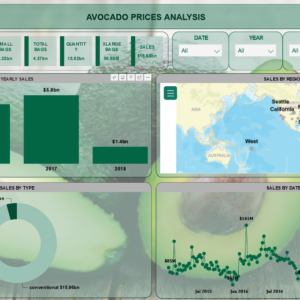
This is comparative analysis dashboard. It shows
1.Products
2.Categories
3.Sales Date
4.Budget Variance%
5.Budget Amount
6.Current year sales
7.Previous year sales
8.Year to year sales growth %
9.Total Sales
Purpose
The purpose of the comparative analysis dashboard is to provide a comprehensive and visual comparison of sales-related metrics for various products and categories over different time periods. By featuring products, categories, sales dates, budget variance percentage, budget amount, current year sales, previous year sales, year-to-year sales growth percentage, and total sales, the dashboard facilitates a holistic understanding of performance trends. Stakeholders, such as business managers and analysts, can leverage this tool to assess budget adherence, identify sales growth or decline, and make informed decisions based on historical and current sales data. This comparative analysis supports strategic planning, budget optimization, and the identification of successful products or categories contributing to overall sales growth.
Only logged in customers who have purchased this product may leave a review.
Related products
-
- Sale!
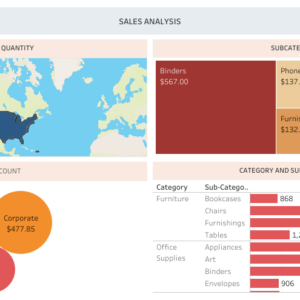
Sales Analysis
- Original price was: $ 15.$ 10Current price is: $ 10.
- Add to cart
-
- Sale!
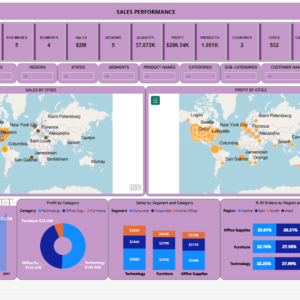
Sales Performance
- Original price was: $ 15.$ 10Current price is: $ 10.
- Add to cart
-
- Sale!
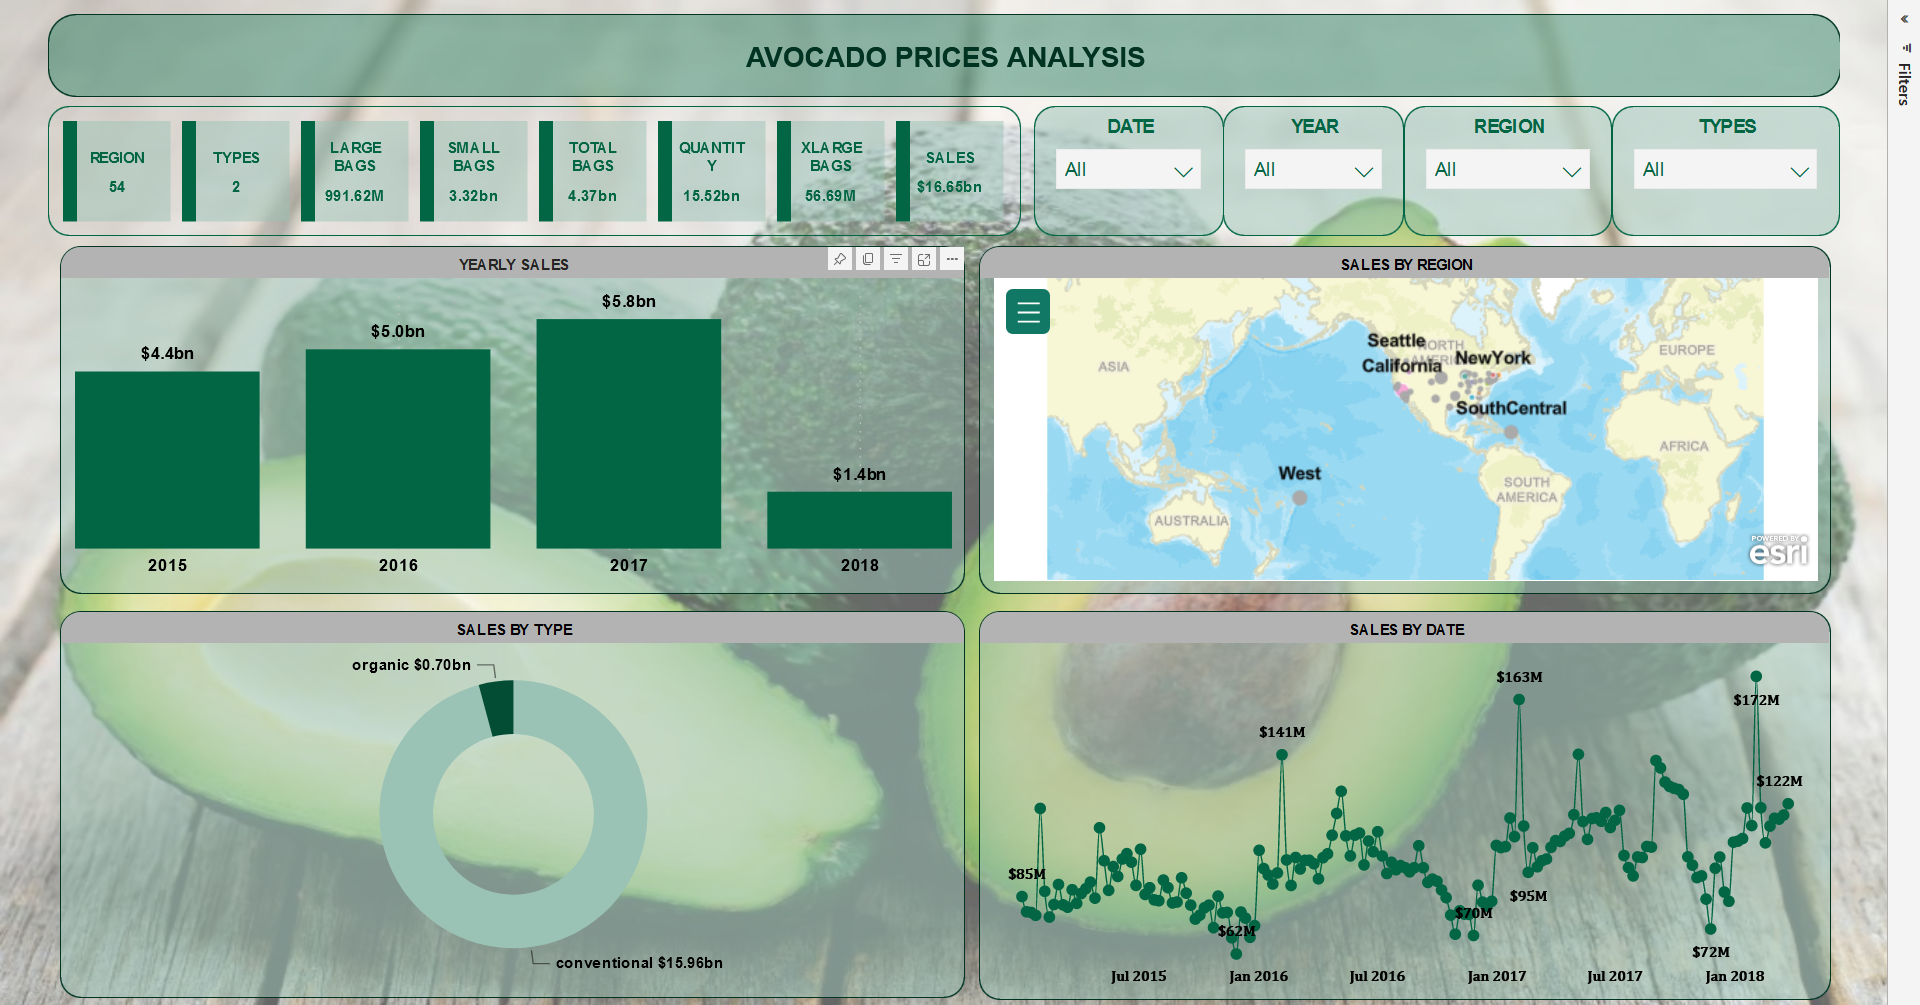
Avocado Prices Analysis
- Original price was: $ 20.$ 15Current price is: $ 15.
- Add to cart
Reviews
There are no reviews yet.