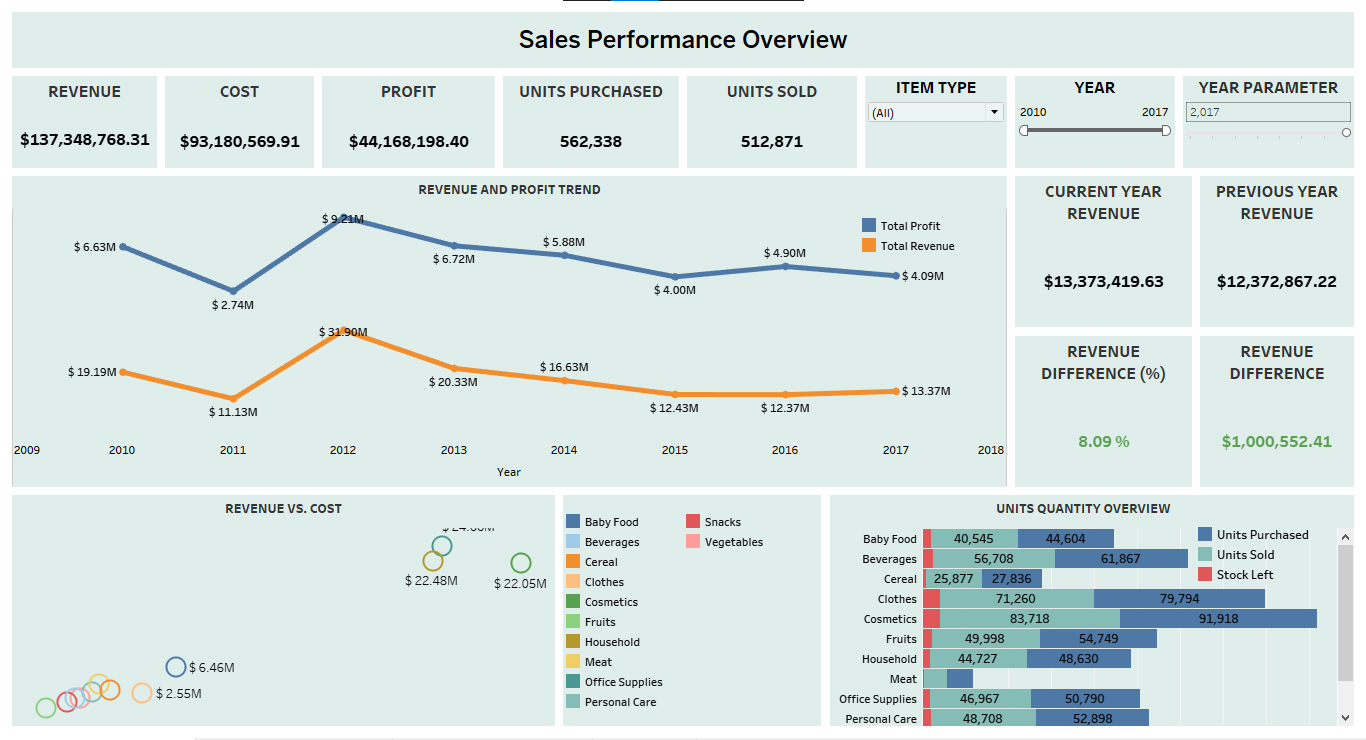
Why You Need a Sales Dashboard for Amazon Business
Managing sales and inventory across thousands of products can be overwhelming—unless you’re using a powerful, visual dashboard. Our Tableau-powered Amazon Sales Dashboard brings your sales, stock, and profit data together in one interactive space.
Whether you’re a solo Amazon seller or an analytics lead in a large team, this dashboard helps you:
- Understand real-time business performance
- Make data-driven decisions
- Identify profitable categories and regions
- Prevent inventory gaps and overstocking
Key Performance Indicators (KPIs) That Matter
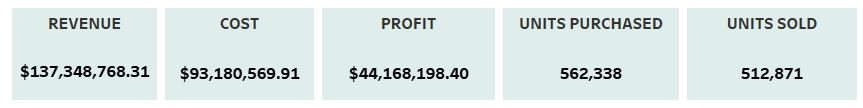
We focused on the most actionable KPIs that define the success of your e-commerce business:
Total Revenue
This metric reflects all income generated from product sales. By monitoring this over time, you’ll understand growth momentum and campaign impact.
Total Cost
Tracks overall expenses, including purchase costs. This lets you control margins and spot rising costs early.
Profit
The real heartbeat of your business. This is calculated as revenue minus cost, showing how efficiently you’re converting sales into earnings.
Units Purchased vs. Units Sold
Helps evaluate sales velocity and inventory efficiency. The gap between the two reveals what’s still sitting in your warehouse.
Year-Wise Revenue & Profit Trends – Visualised
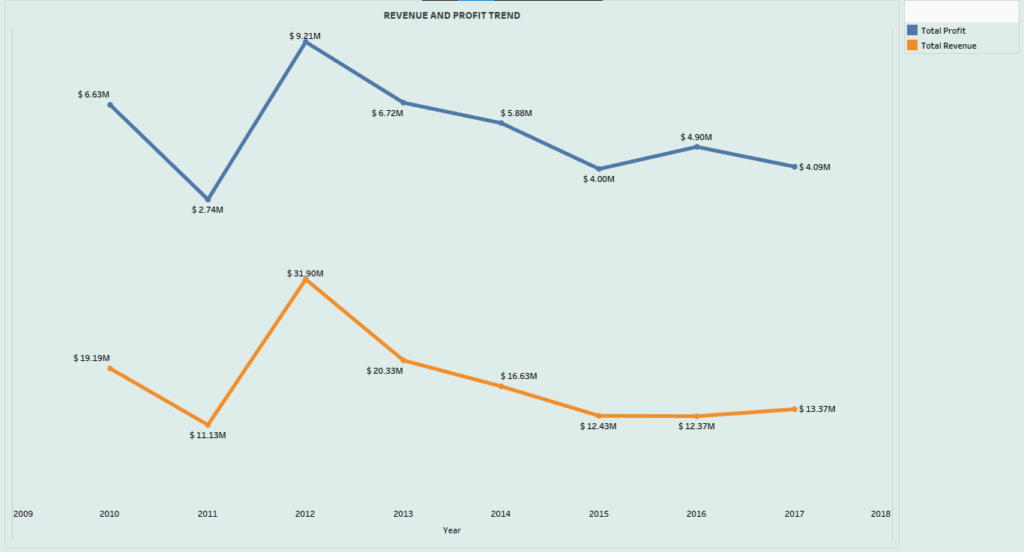
This powerful dual-line chart shows revenue and profit over time. It instantly highlights:
- Best-performing periods
- Downturns or drops
- Consistent profitability streaks
Use these insights to forecast better and set smarter targets for upcoming quarters.
Revenue vs. Cost: Product Category Performance

We used a scatter plot to compare revenue and cost across categories like:
- Baby Food
- Cosmetics
- Clothes
- Fruits
- Office Supplies
Each bubble shows a product category—its size reflects the scale of sales. This helps you:
- Identify high-cost, low-return segments
- Invest more in high-margin categories
- Streamline your product portfolio
Example Insight: If Cosmetics have high costs but relatively lower revenue, consider renegotiating supplier terms or adjusting pricing.
Inventory Insights: What’s Left in the Warehouse?
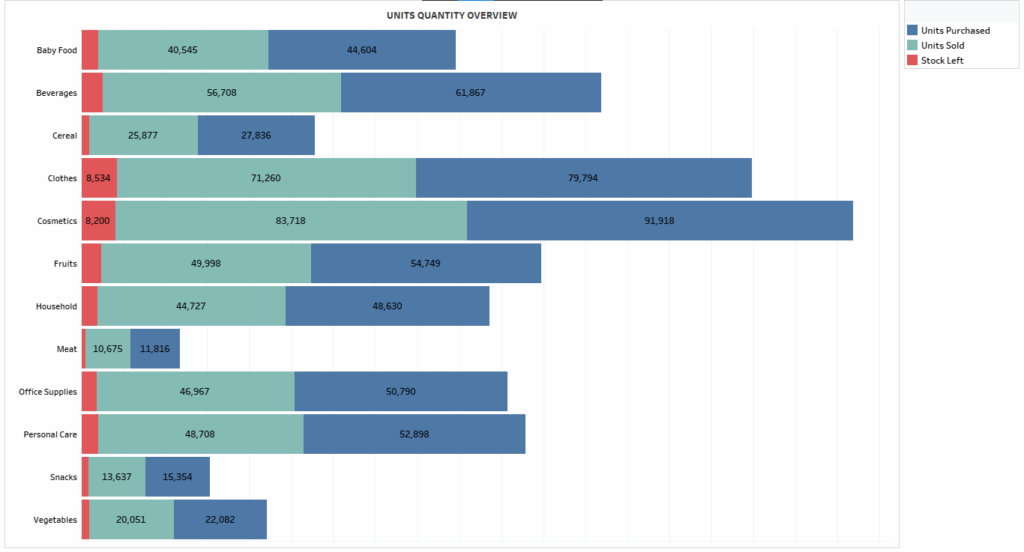
You can’t run a profitable store if your warehouse is full of unsold stock. That’s why we calculate:
- Units Purchased (estimated using sold units plus buffer)
- Units Sold
- Stock Remaining
We simulate Units Purchased using this formula:
Units Purchased = Units Sold + RANDBETWEEN(Low %, High % of Units Sold)
Then:
Remaining Stock = Units Purchased - Units Sold
This gives you a live snapshot of stock health and helps avoid over-ordering.
Revenue Comparison: This Year vs. Last Year
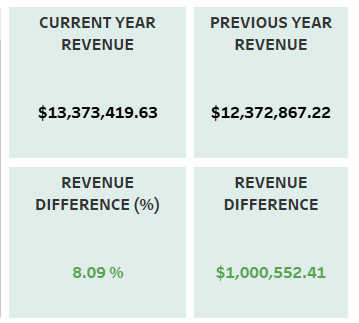
Year-on-year analysis includes:
- Current Revenue
- Previous Revenue
- Growth Difference (in percentage and currency)
This instantly shows if your business is growing or shrinking and highlights where performance improved or dipped.
Final Thoughts: Why This Dashboard Changes Everything
This dashboard isn’t just a pretty chart—it’s your command center for smarter selling on Amazon. It gives:
- A clear view of profits, stock, and costs
- A better handle on inventory trends
- Strategic visibility into regional and category-level performance
Use it to plan campaigns, predict demand, and optimize product lines.


