Introduction:
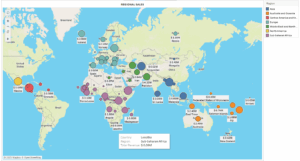
In the ever-evolving landscape of the avocado industry, staying ahead of market trends and making informed decisions is crucial for stakeholders. The Avocado Prices Analysis Dashboard, powered by Microdata-Lake NSDUSTRY, emerges as a game-changing tool for growers, distributors, and retailers. This comprehensive dashboard provides a detailed overview of key metrics, enabling stakeholders to navigate the complexities of the avocado market.
Features of the Avocado Prices Analysis Dashboard:
Sales Analysis:
- The dashboard offers a granular breakdown of sales data, allowing stakeholders to analyze revenue streams comprehensively. Users can track sales performance over time, identifying patterns and trends that impact financial success.
Quantity Metrics:
- Stakeholders can delve into quantity metrics such as total bags, small bags, large bags, and XLarge bags. This level of detail is instrumental in understanding consumer preferences, optimizing production, and managing inventory effectively.
Regional Insights:
- Understanding regional disparities is crucial in the avocado industry. The dashboard provides a regional analysis, enabling stakeholders to identify market hotspots, track distribution patterns, and tailor strategies based on geographic demand variations.
Packaging Distribution:
- The distribution of avocados in different bag sizes is a critical aspect of market dynamics. With a focus on small bags, large bags, and XLarge bags, the dashboard empowers stakeholders to optimize packaging strategies and respond to changing consumer preferences.
Avocado Types:
- The dashboard categorizes avocado types, allowing stakeholders to discern market preferences for different varieties. This insight is invaluable for growers and distributors looking to align their offerings with consumer demands.
Date and Year Analysis:
- Time is a crucial dimension in the avocado market. The dashboard facilitates date and year-based analysis, enabling stakeholders to identify seasonal patterns, plan marketing strategies accordingly, and make data-driven decisions for each period.
Benefits for Stakeholders:
The Avocado Prices Analysis Dashboard offers numerous benefits for stakeholders in the industry:
Informed Decision-Making:
- Armed with detailed insights, growers, distributors, and retailers can make informed decisions, whether it’s adjusting production volumes, optimizing inventory levels, or refining marketing strategies.
Market Preferences and Trends:
- By analyzing data on bag sizes, avocado types, and regional variations, stakeholders can identify evolving market preferences and capitalize on emerging trends.
Strategic Planning:
The dashboard provides a strategic edge by revealing patterns and variations in sales and quantity metrics. Stakeholders can proactively plan for fluctuations, capitalize on peak seasons, and navigate market challenges effectively.
Enhanced Collaboration:
- The dashboard fosters collaboration among industry players by providing a common platform for data analysis. This collaborative approach can lead to mutually beneficial partnerships and a more resilient avocado industry.
Conclusion:
In the competitive and dynamic avocado market, the Avocado Prices Analysis Dashboard emerges as a powerful tool for stakeholders. By offering a comprehensive view of sales, quantity, regional trends, and packaging distribution, this dashboard empowers industry players to make informed decisions, foster growth, and navigate the complexities of the avocado market with confidence. In the world of avocados, knowledge is power, and the Avocado Prices Analysis Dashboard is the key to unlocking that power for stakeholders across the supply chain.


